
Gestures
Gestures allow users to pan and zoom into plots to analyse points and trends. However, gestures can also be used to control plot elements or draw new points. By default, gestures are enabled through tapping for xyPlots and timePlots, and completely disabled for drawings.
Enable/Disable All
You can completely enable or disable gestures by setting the manual attribute inside your plot declaration to true or false. See the example below.
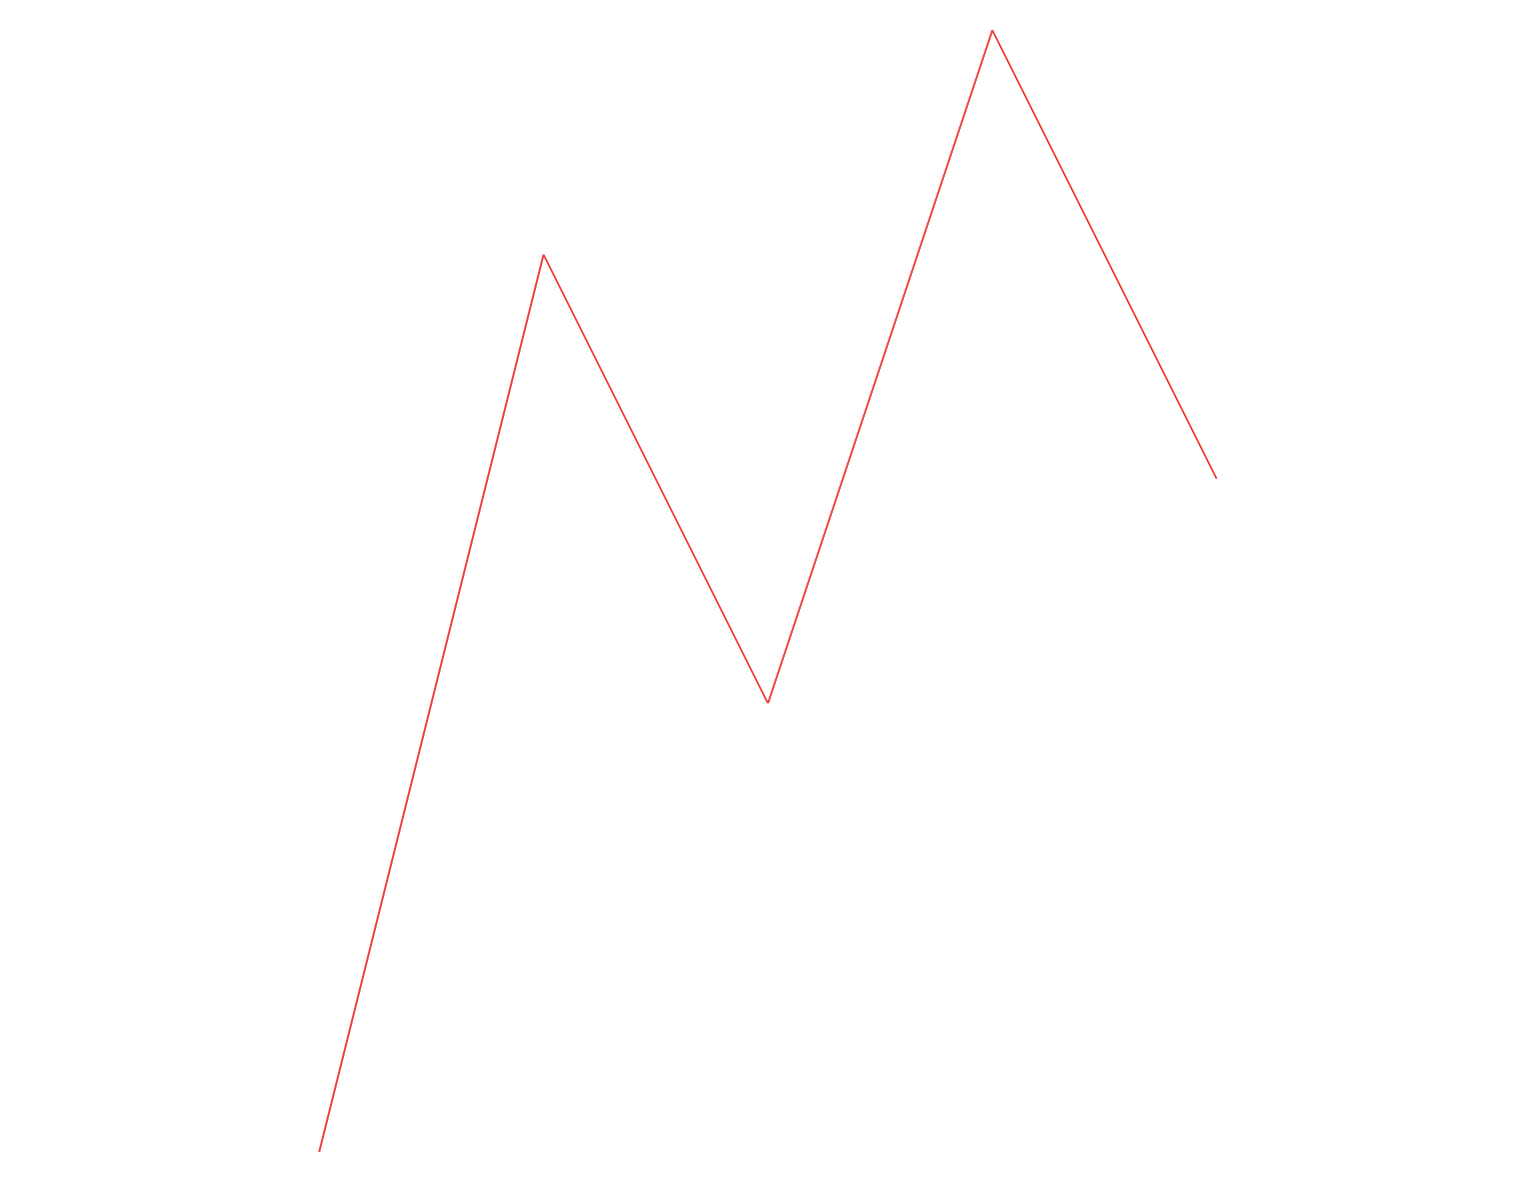
Disabled Gestures
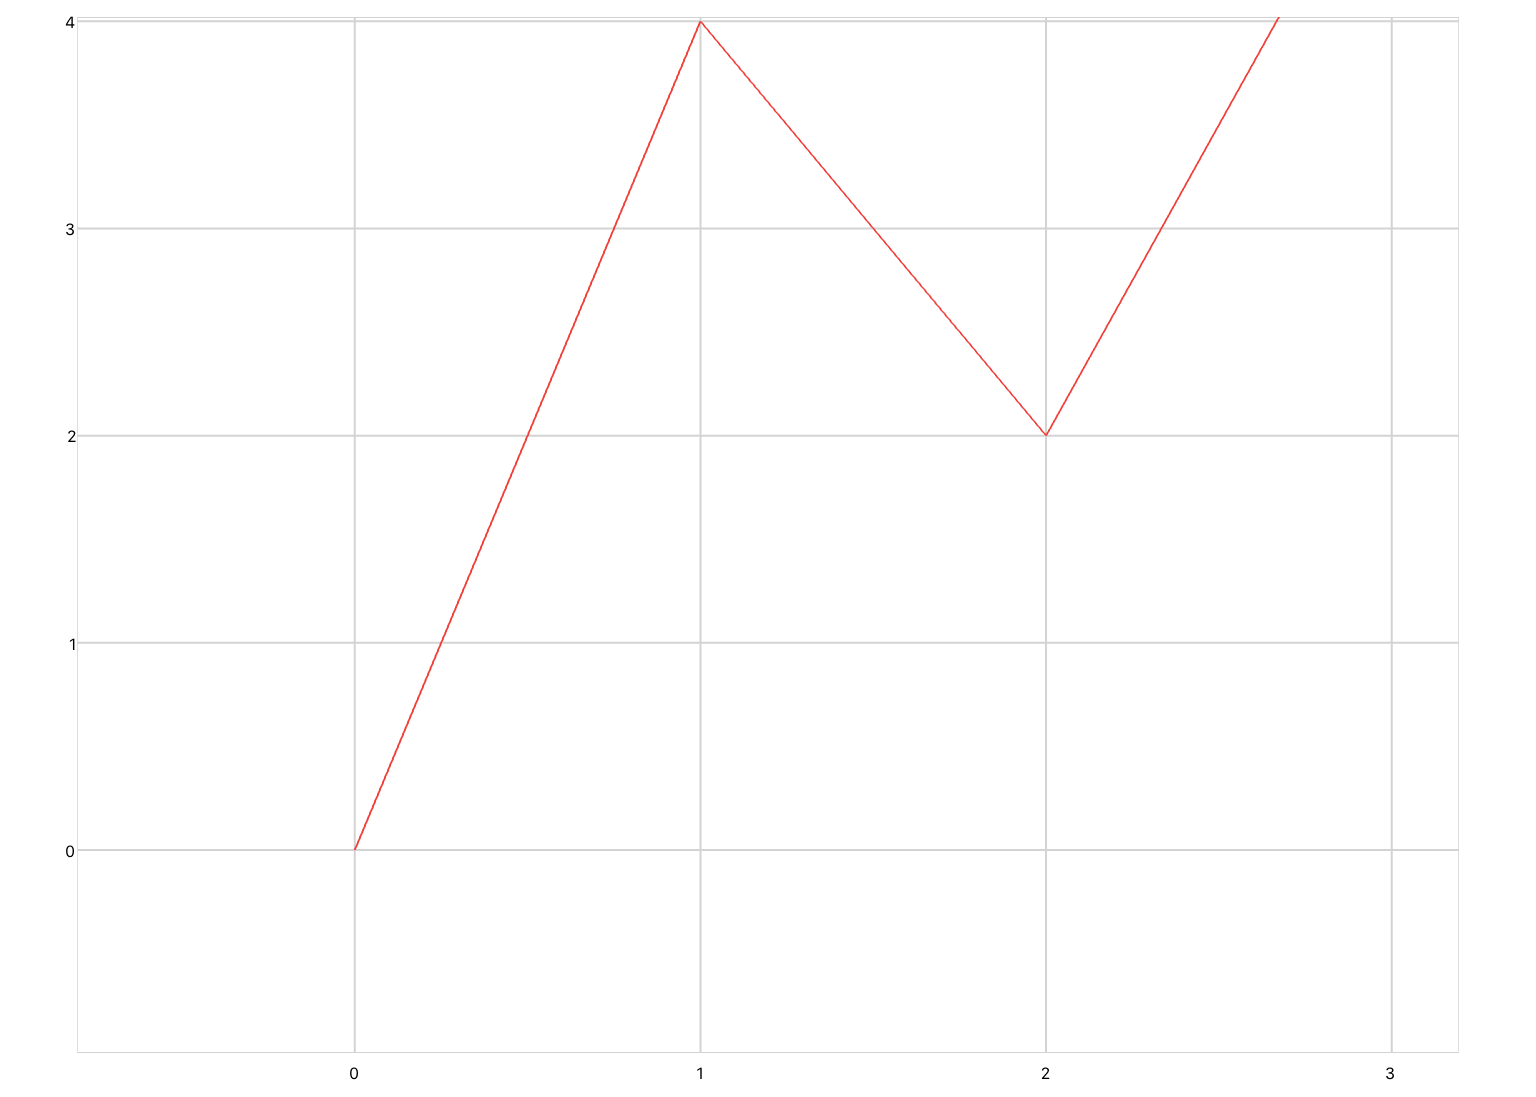
Default
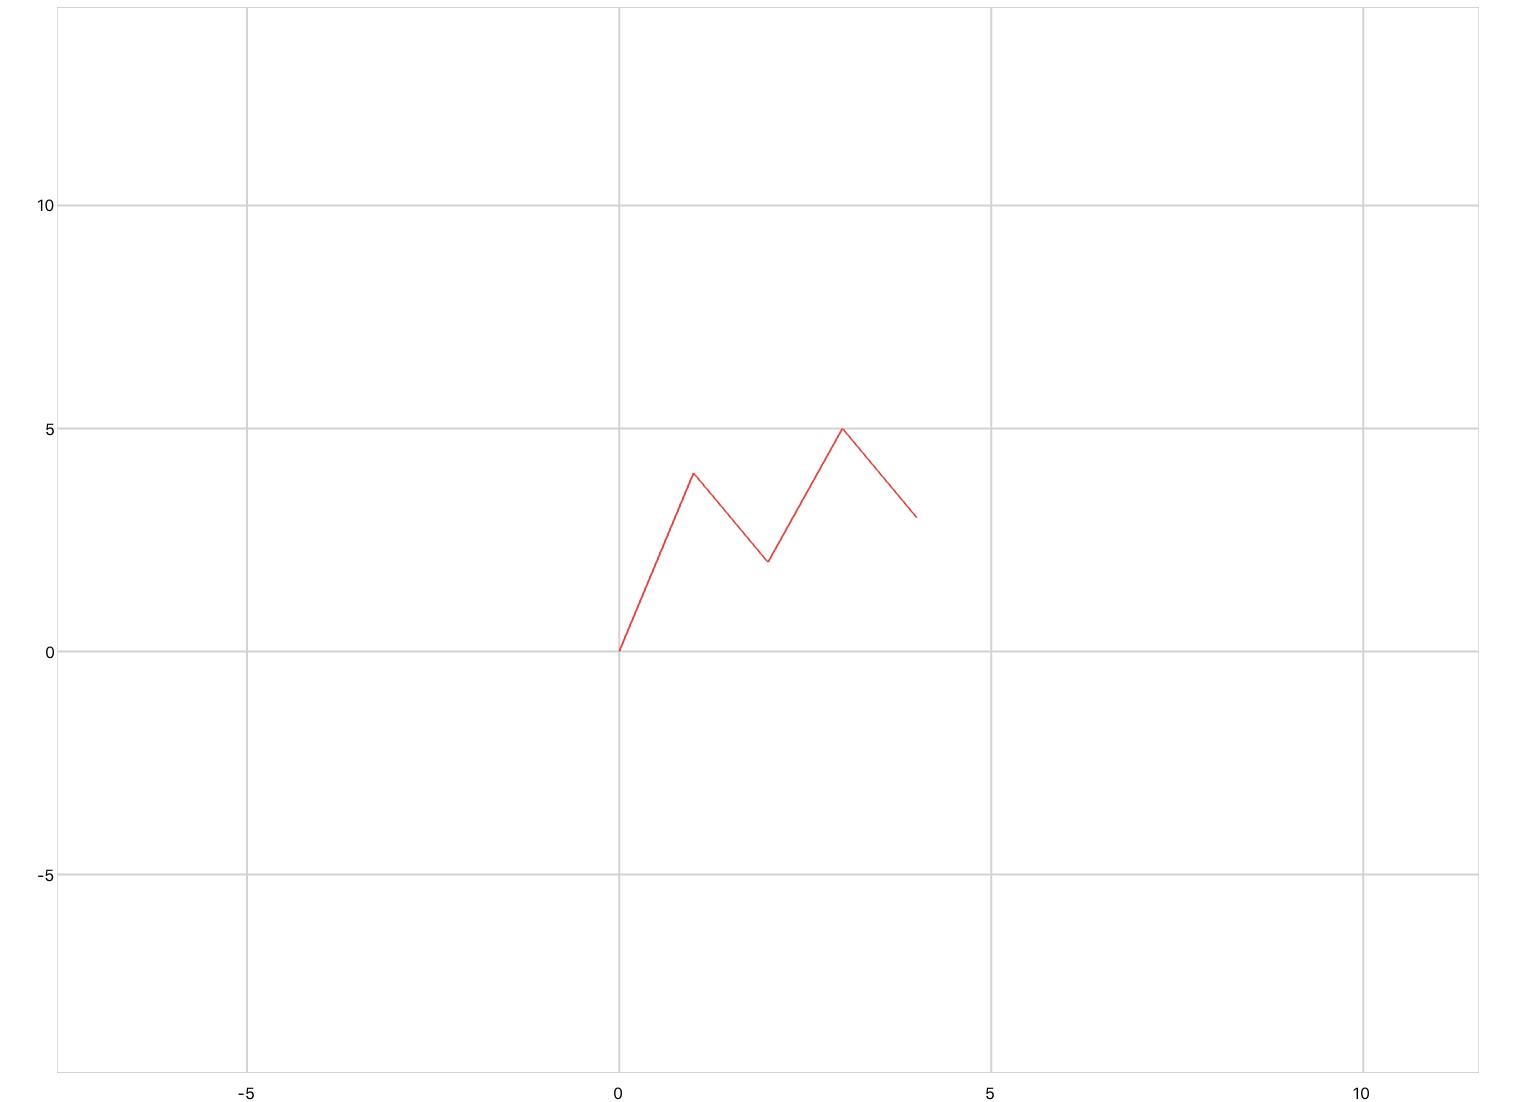
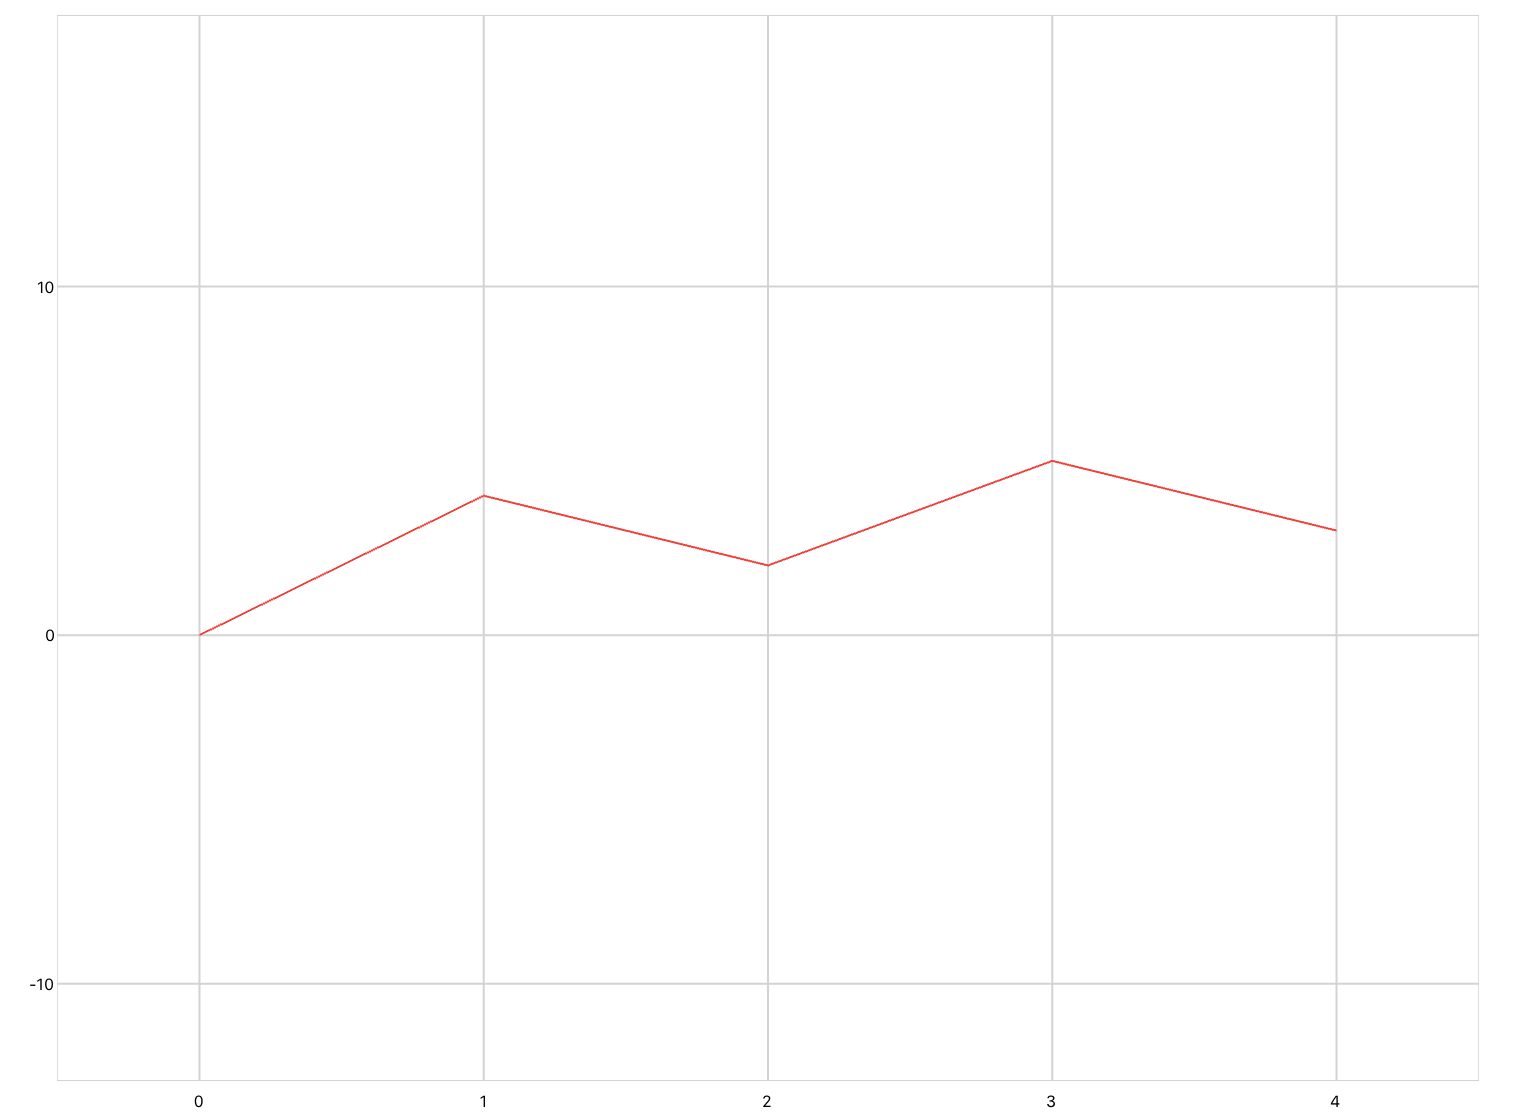
<xyPlot manual="false">
  <axis dim="x" />
  <axis dim="y" />
  <series>
    <data>0 0; 1 4; 2 2; 3 5; 4 3</data>
  </series>
</xyPlot>
<xyPlot manual="true">
  <axis dim="x" />
  <axis dim="y" />
  <series>
    <data>0 0; 1 4; 2 2; 3 5; 4 3</data>
  </series>
</xyPlot>

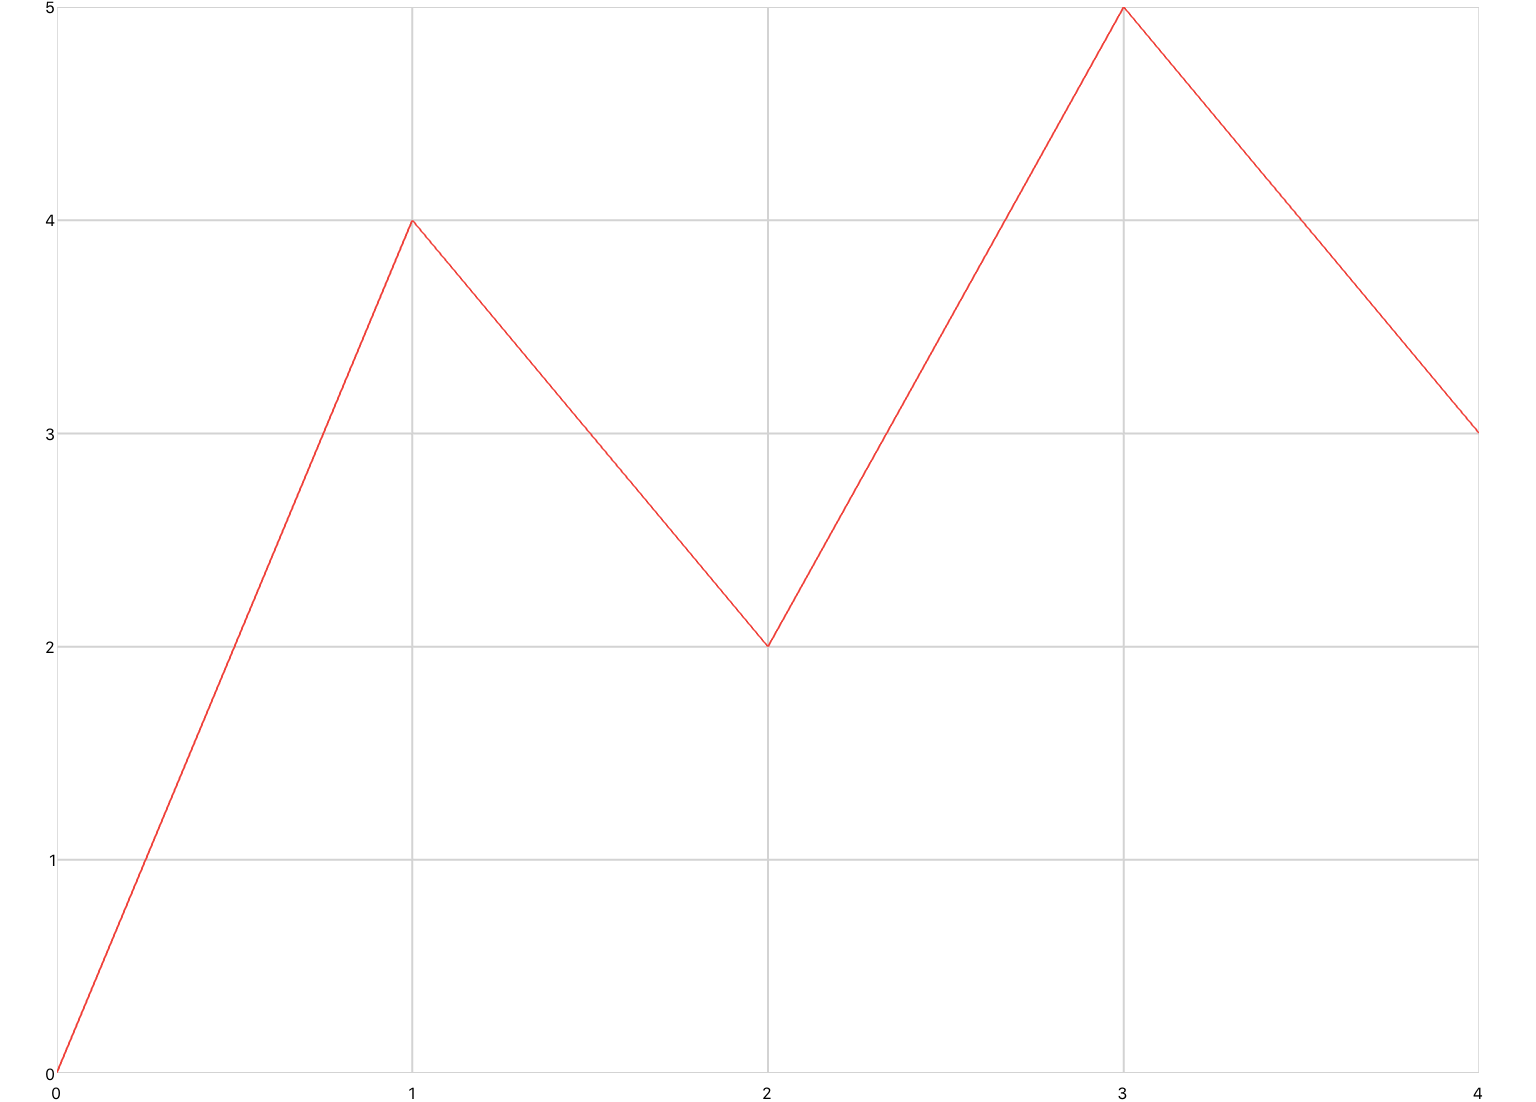
When manual is set to true, plots will pan and zoom as soon as they are touched. If the manual attribute is not set, the plot must first be tapped on to enable gestures.
Enable/Disable Individual
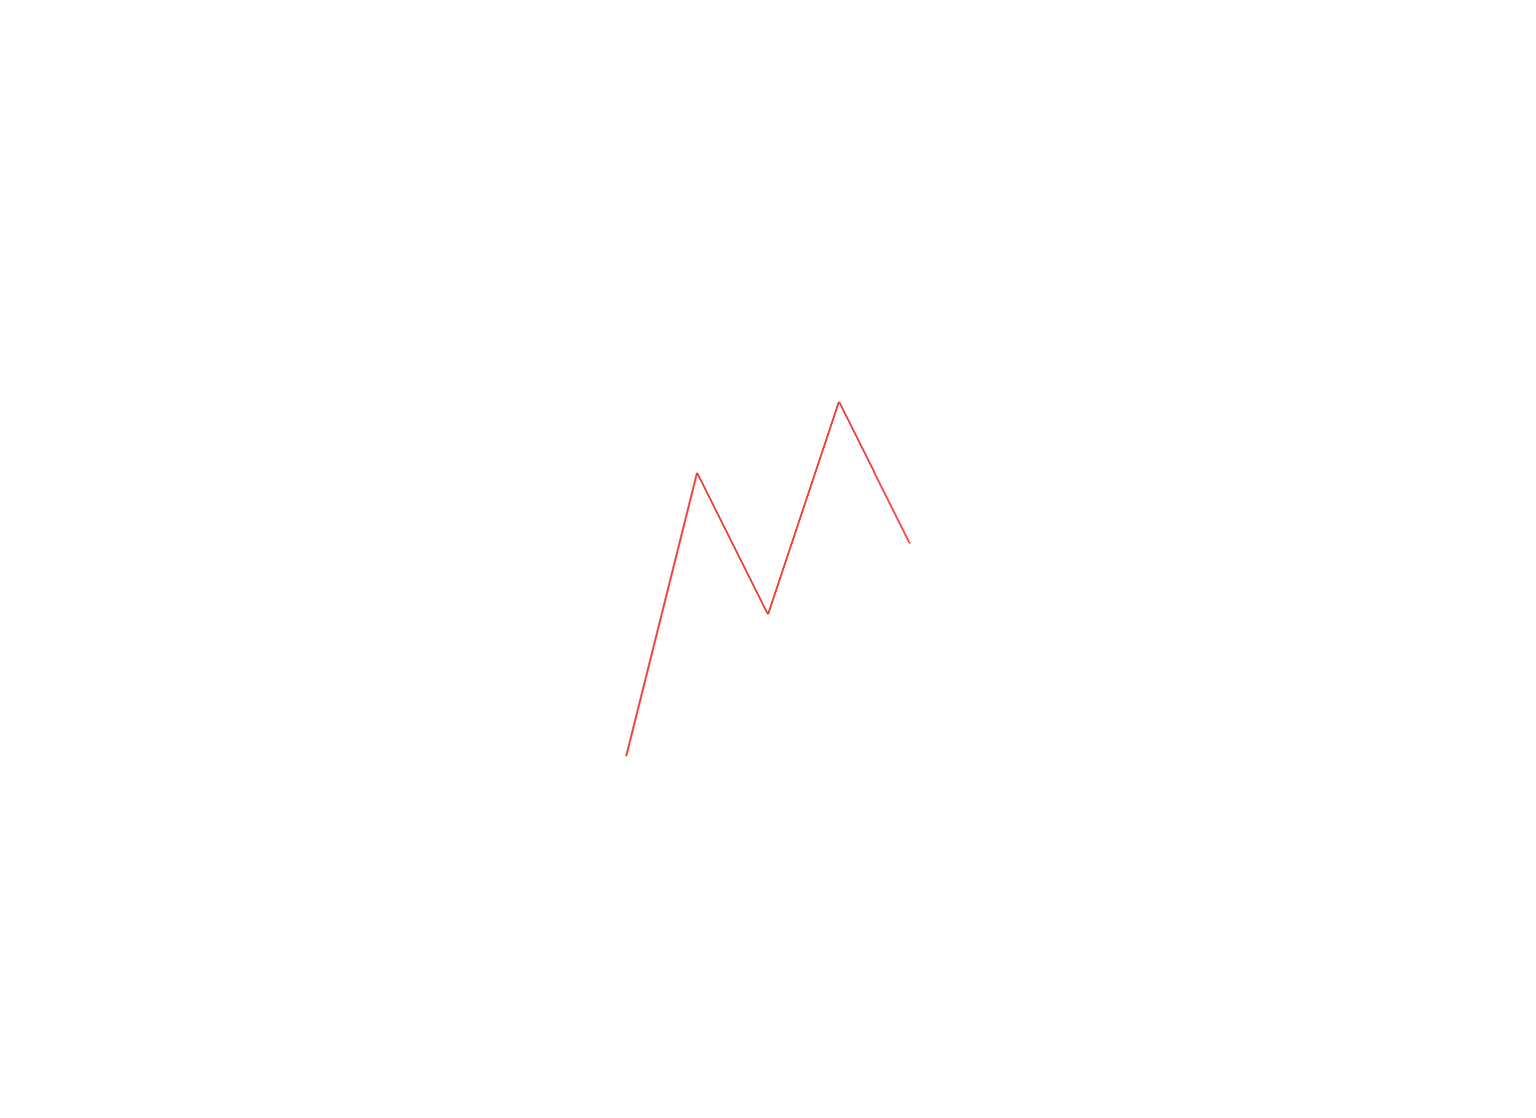
You can enable or disable individual gestures by setting the pan, tap or zoom plot attributes to enabled or disabled. Note that on a drawing plot you also need to set manual to true.
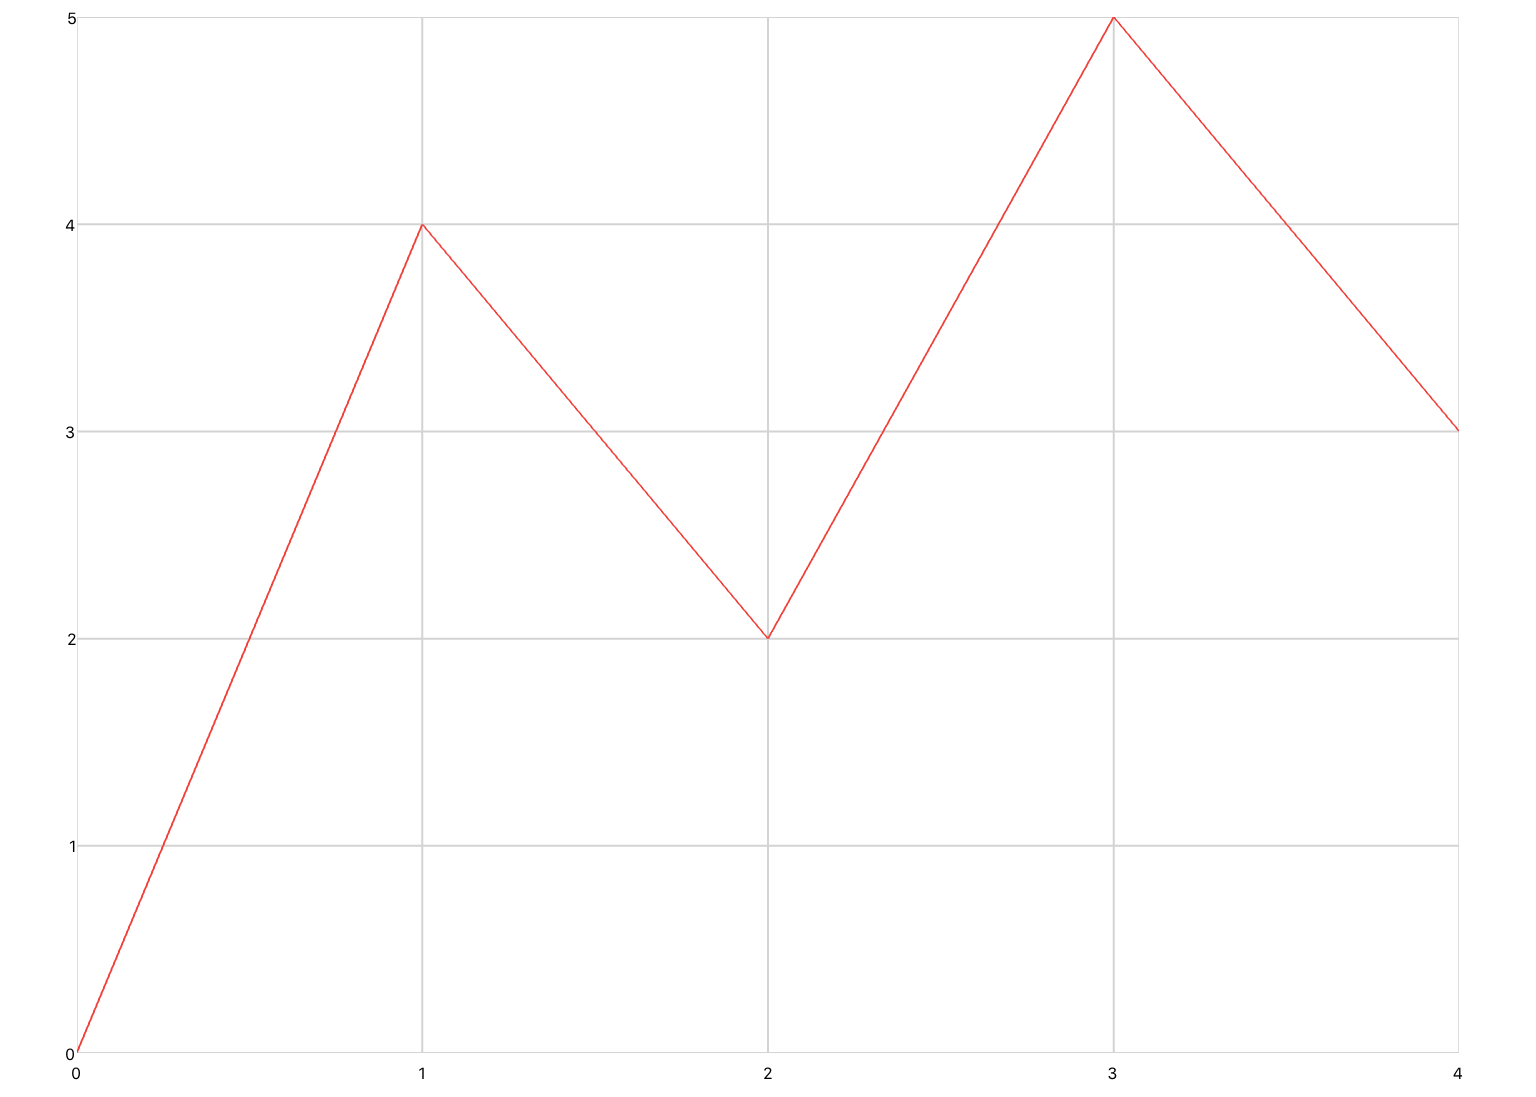
<xyPlot zoom="disabled">
  <series>
    <data>0 0; 1 4; 2 2; 3 5; 4 3</data>
  </series>
</xyPlot>
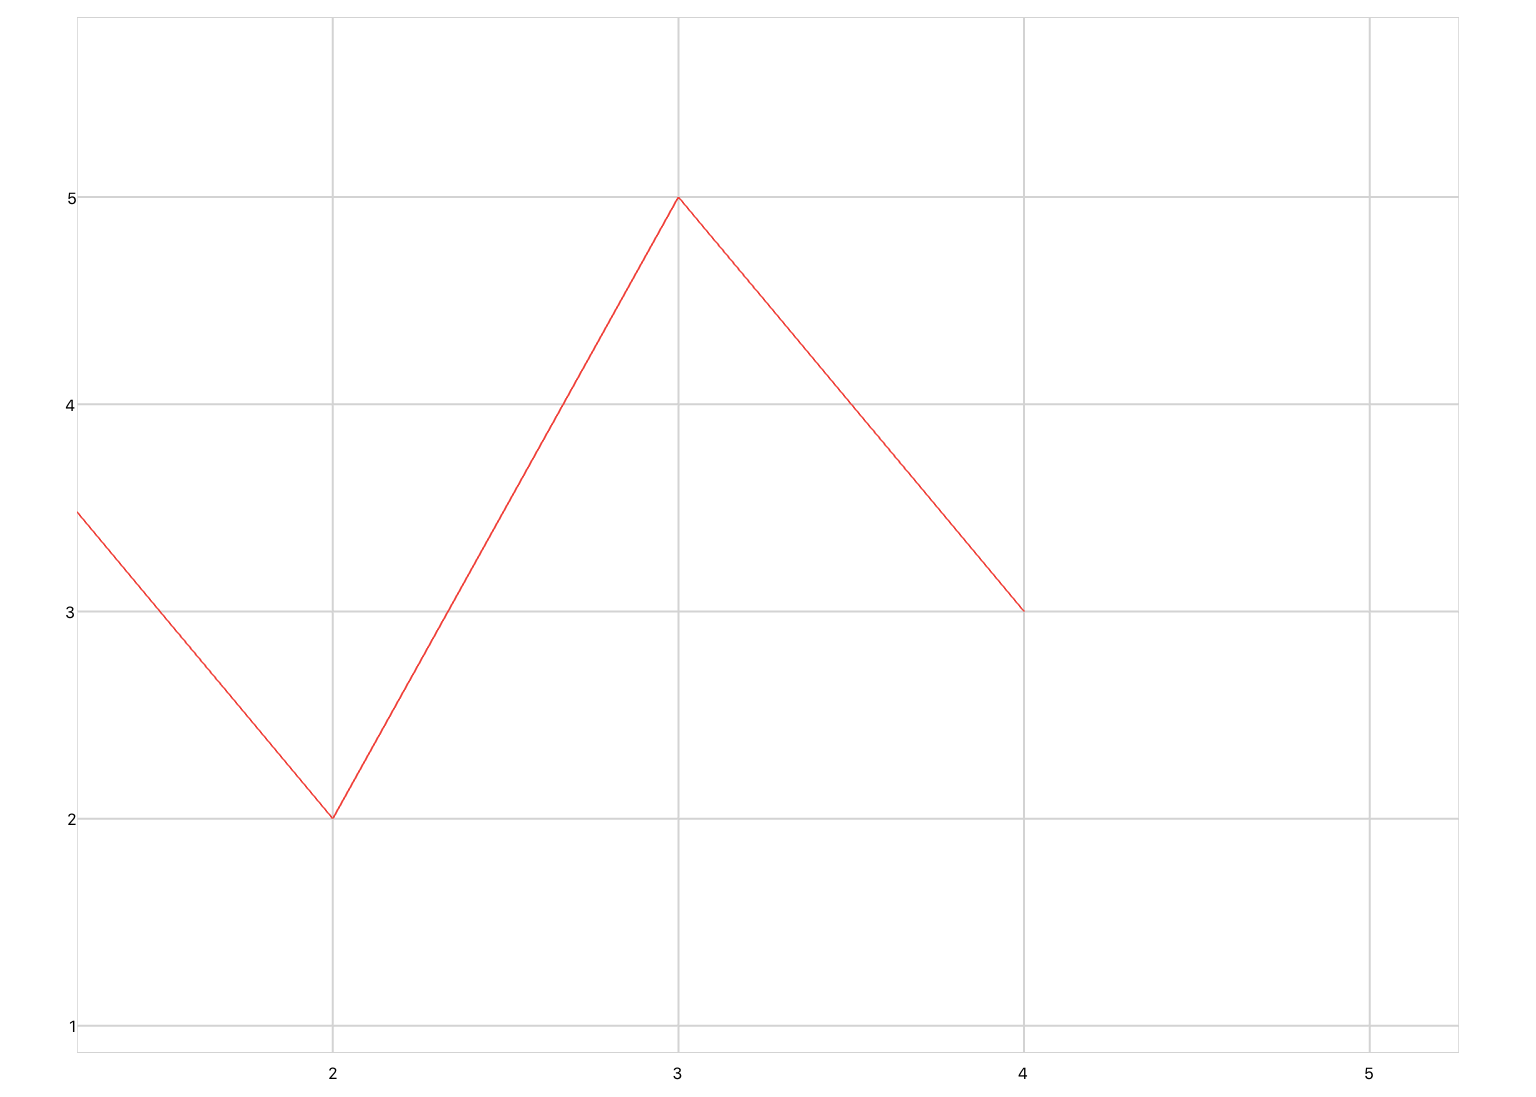
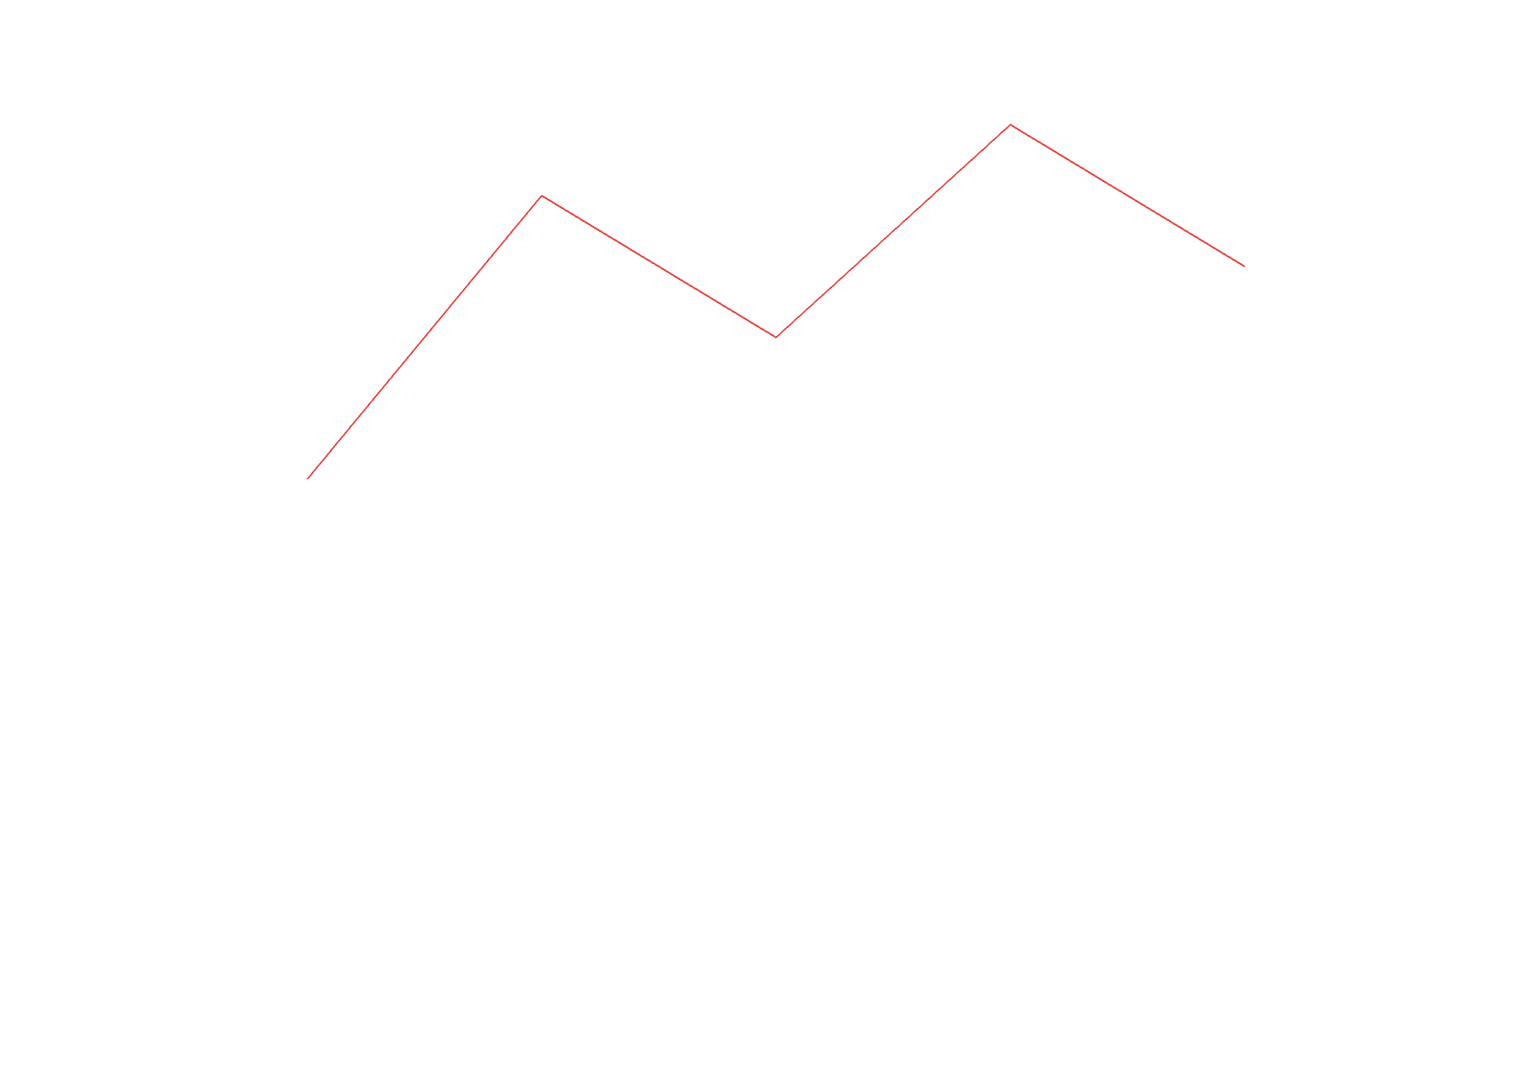
<drawing zoom="enabled" tap="enabled" pan="enabled" manual="true">
  <series>
    <data>0 0; 1 4; 2 2; 3 5; 4 3</data>
  </series>
</drawing>
Custom Gestures
To use custom gestures, set the pan, tap, or zoom attributes to custom. You can then access the onTap, onPan and onZoom events.
By default, all gestures are limited to the range 0-1 in the x and y axes. If you would like to use a custom gesture on a different range you need to scale the gesture input.
Tap
The coordinates of the tap gesture can be accessed using the inherent variables x and y in the onTap event.
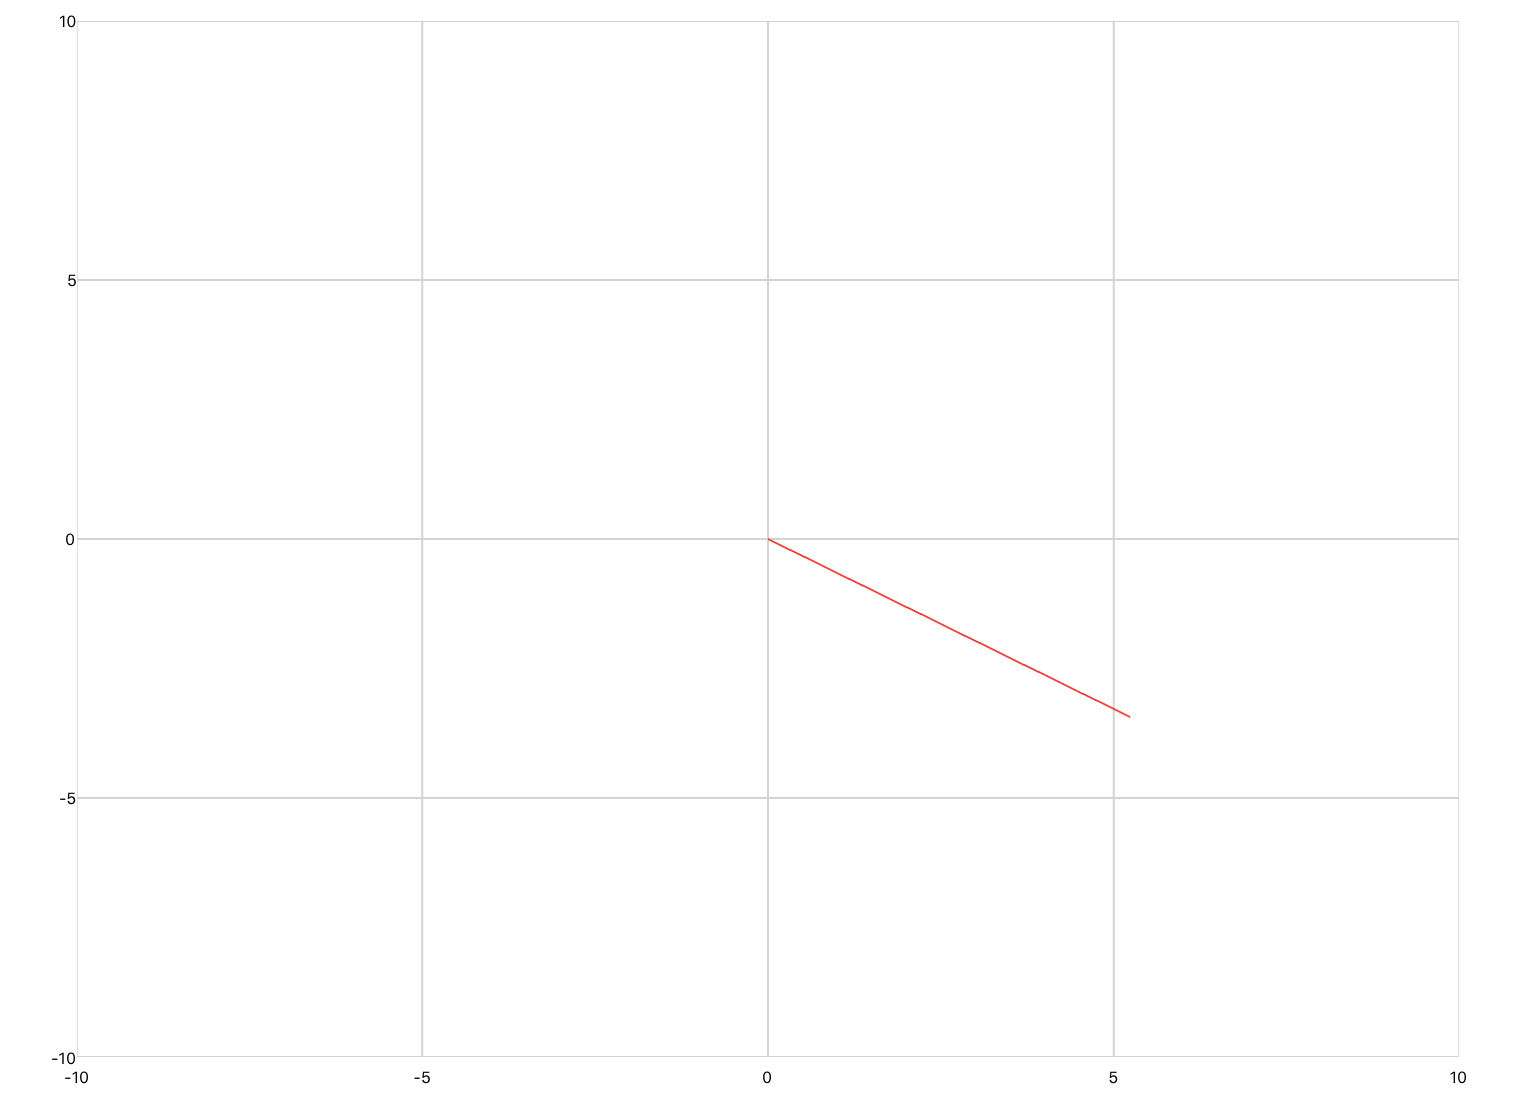
In the below example, a line is drawn between (0,0) and the point that is tapped.
<xyPlot name="tapPlot" tap="custom">
  <axis dim="x" min="0" max="1" auto="fixed" />
  <axis dim="y" min="0" max="1" auto="fixed" />
  <onTap>
    mySeries:Add(0, 0)
    mySeries:Add(x, y)
  </onTap>
  <series name="mySeries" capacity="2" />
</xyPlot>
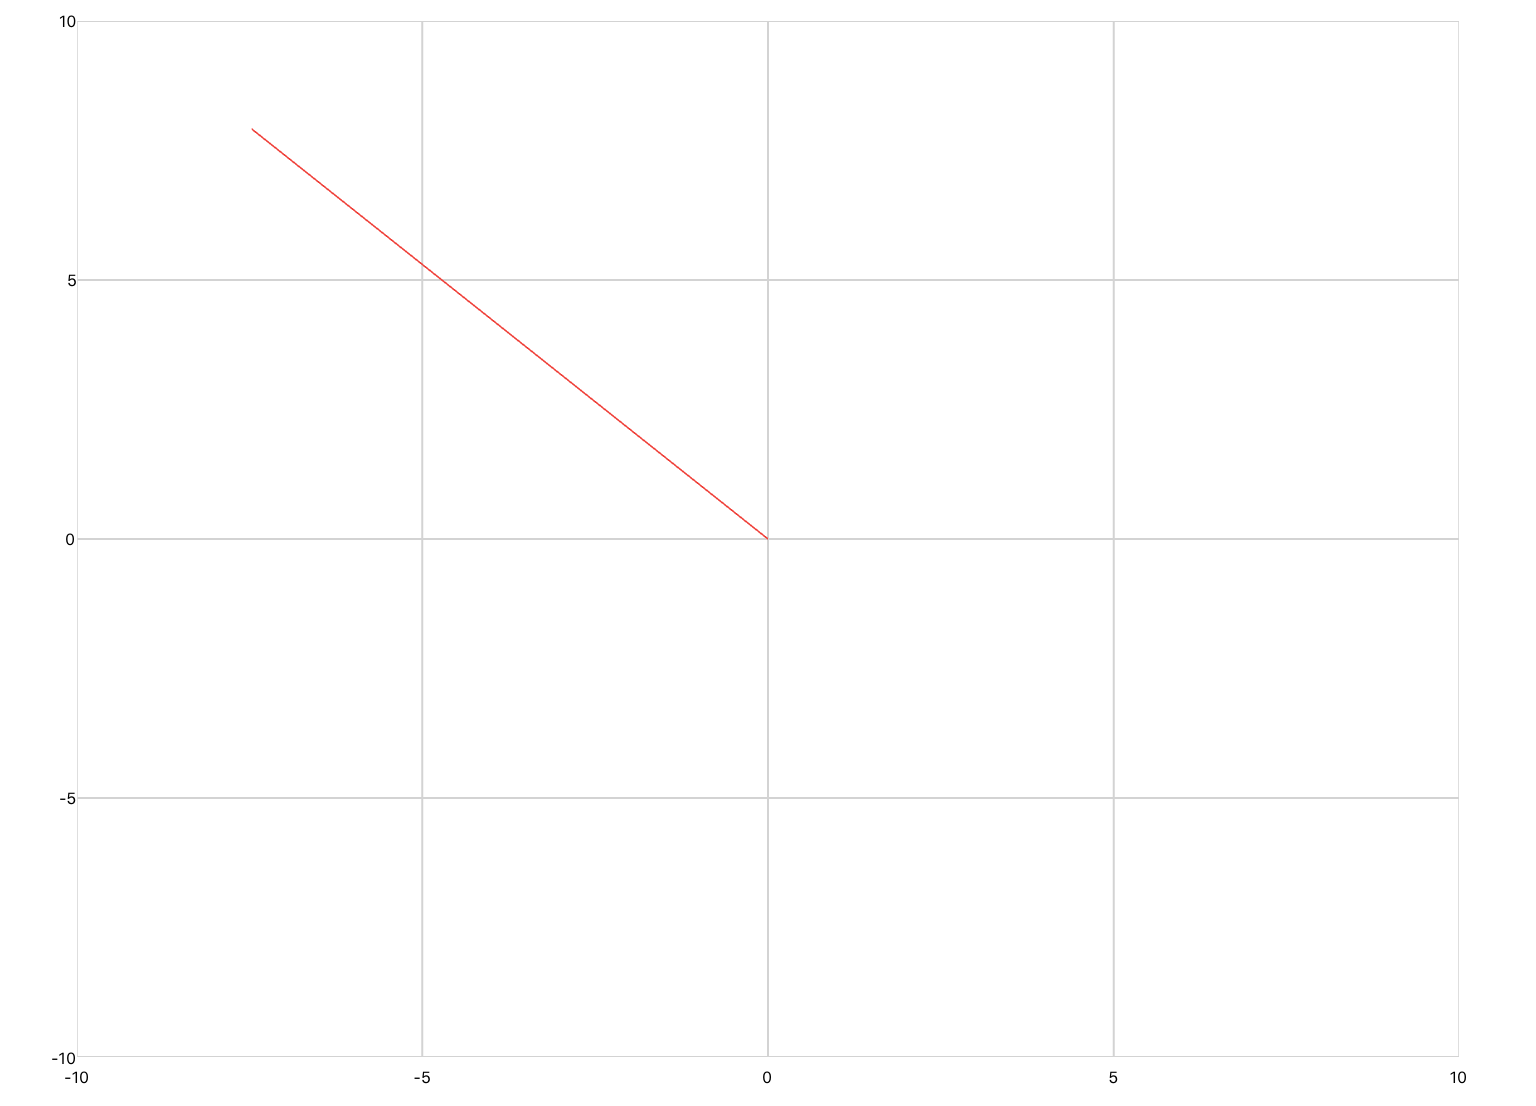
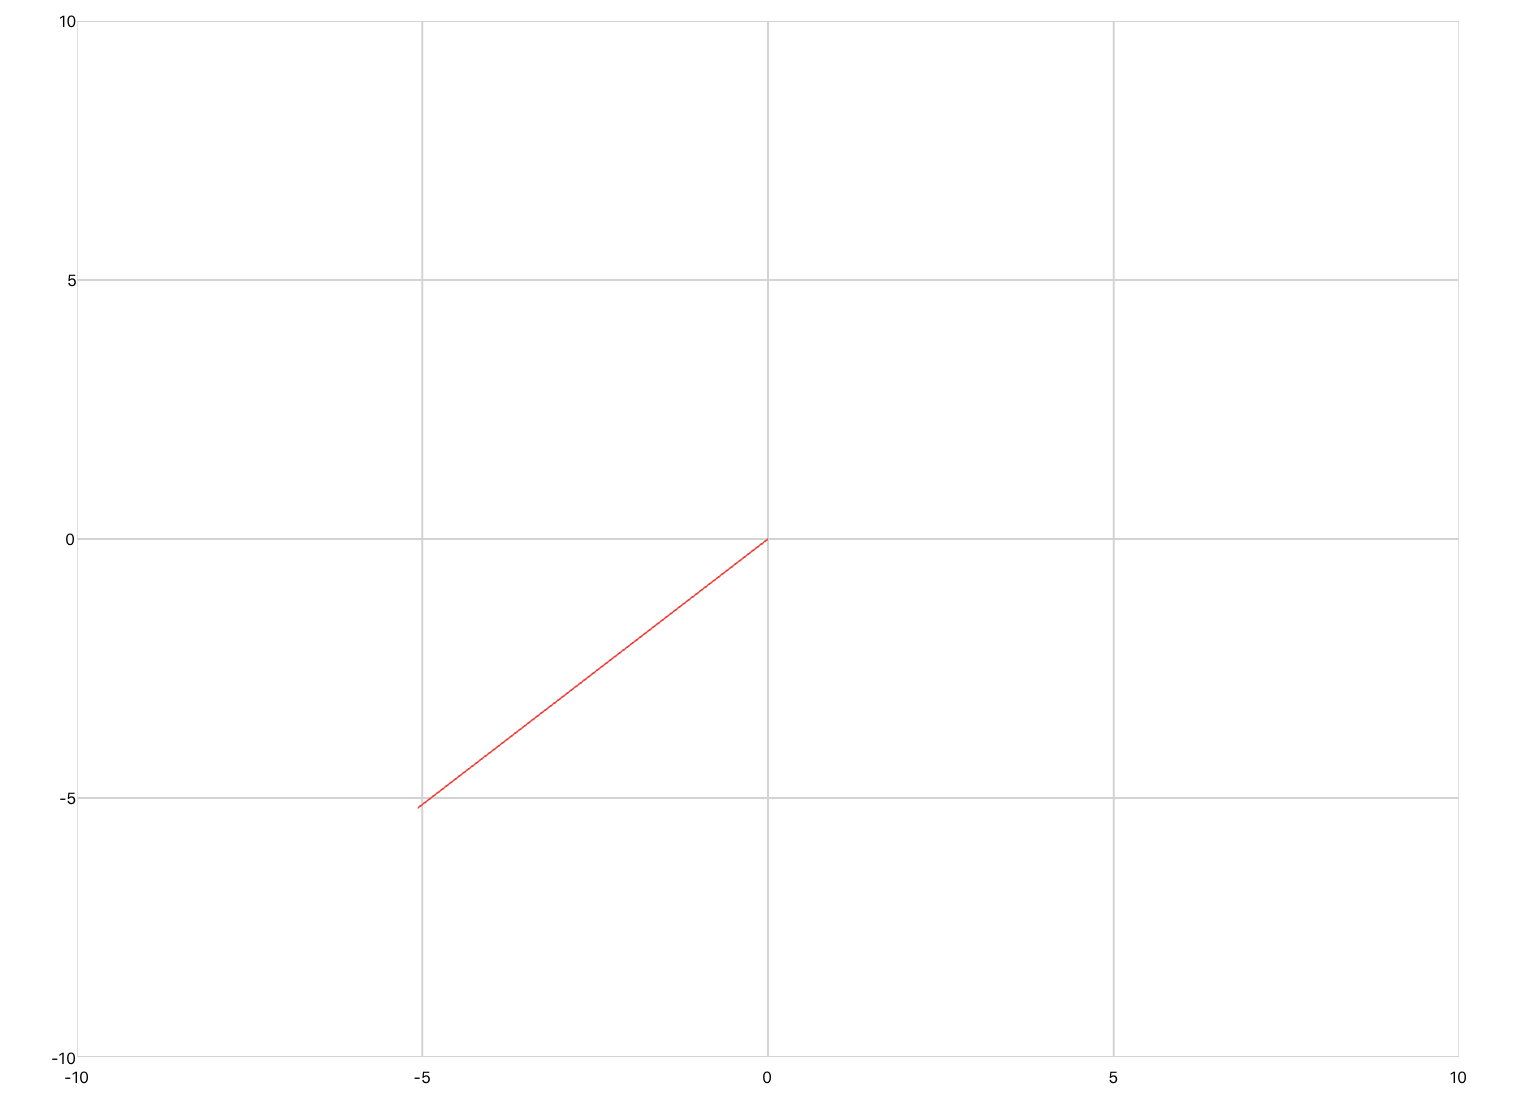
In this next example, a line is drawn between (0,0) and the point that is tapped. The point is first scaled to to an axis range of -10 to 10 in the x and y axes.
<xyPlot name="tapPlot2" tap="custom">
  <axis dim="x" min="-10" max="10" auto="fixed" />
  <axis dim="y" min="-10" max="10" auto="fixed" />
  <onTap>
    scaledX = tapPlot2.XAxis.Min + x * (tapPlot2.XAxis.Max - tapPlot2.XAxis.Min);
    scaledY = tapPlot2.YAxis.Min + y * (tapPlot2.YAxis.Max - tapPlot2.YAxis.Min);
    series:Add(0, 0)
    series:Add(scaledX, scaledY)
  </onTap>
  <series name="series" capacity="2" />
</xyPlot>
Pan
The coordinates of the pan gesture can be accessed using the inherent variables state.Current.X and state.Current.Y in the onPan event.
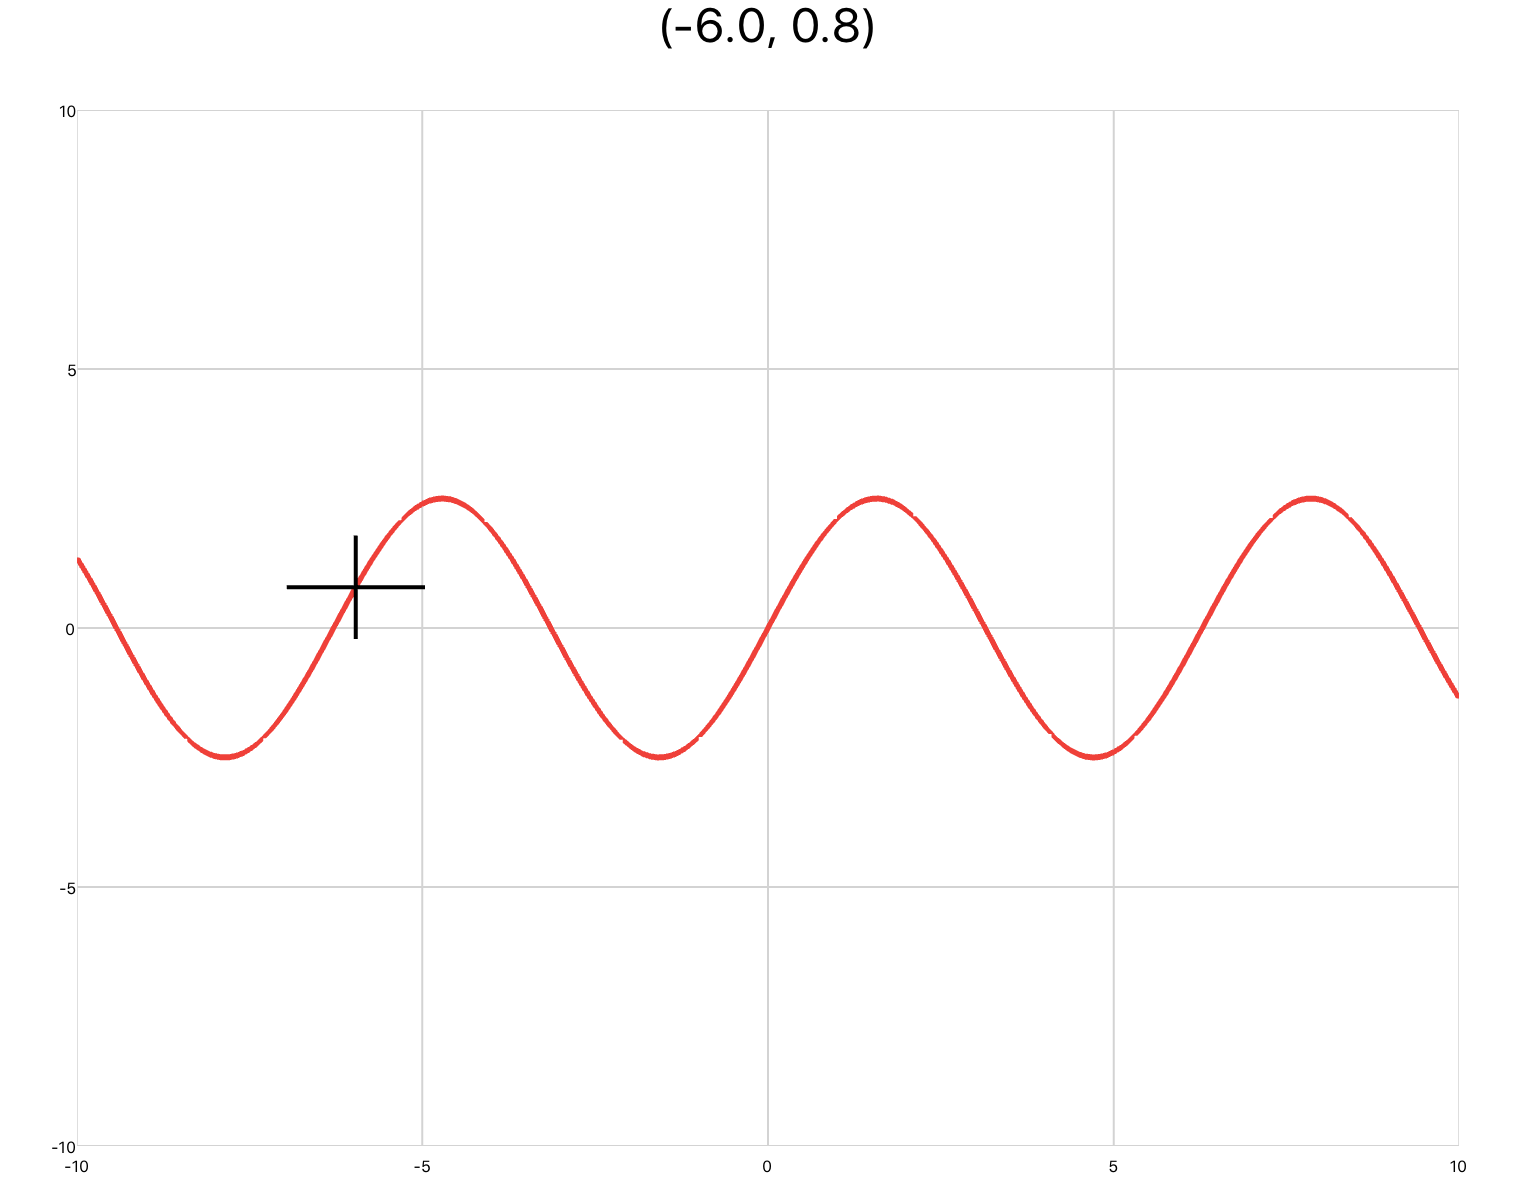
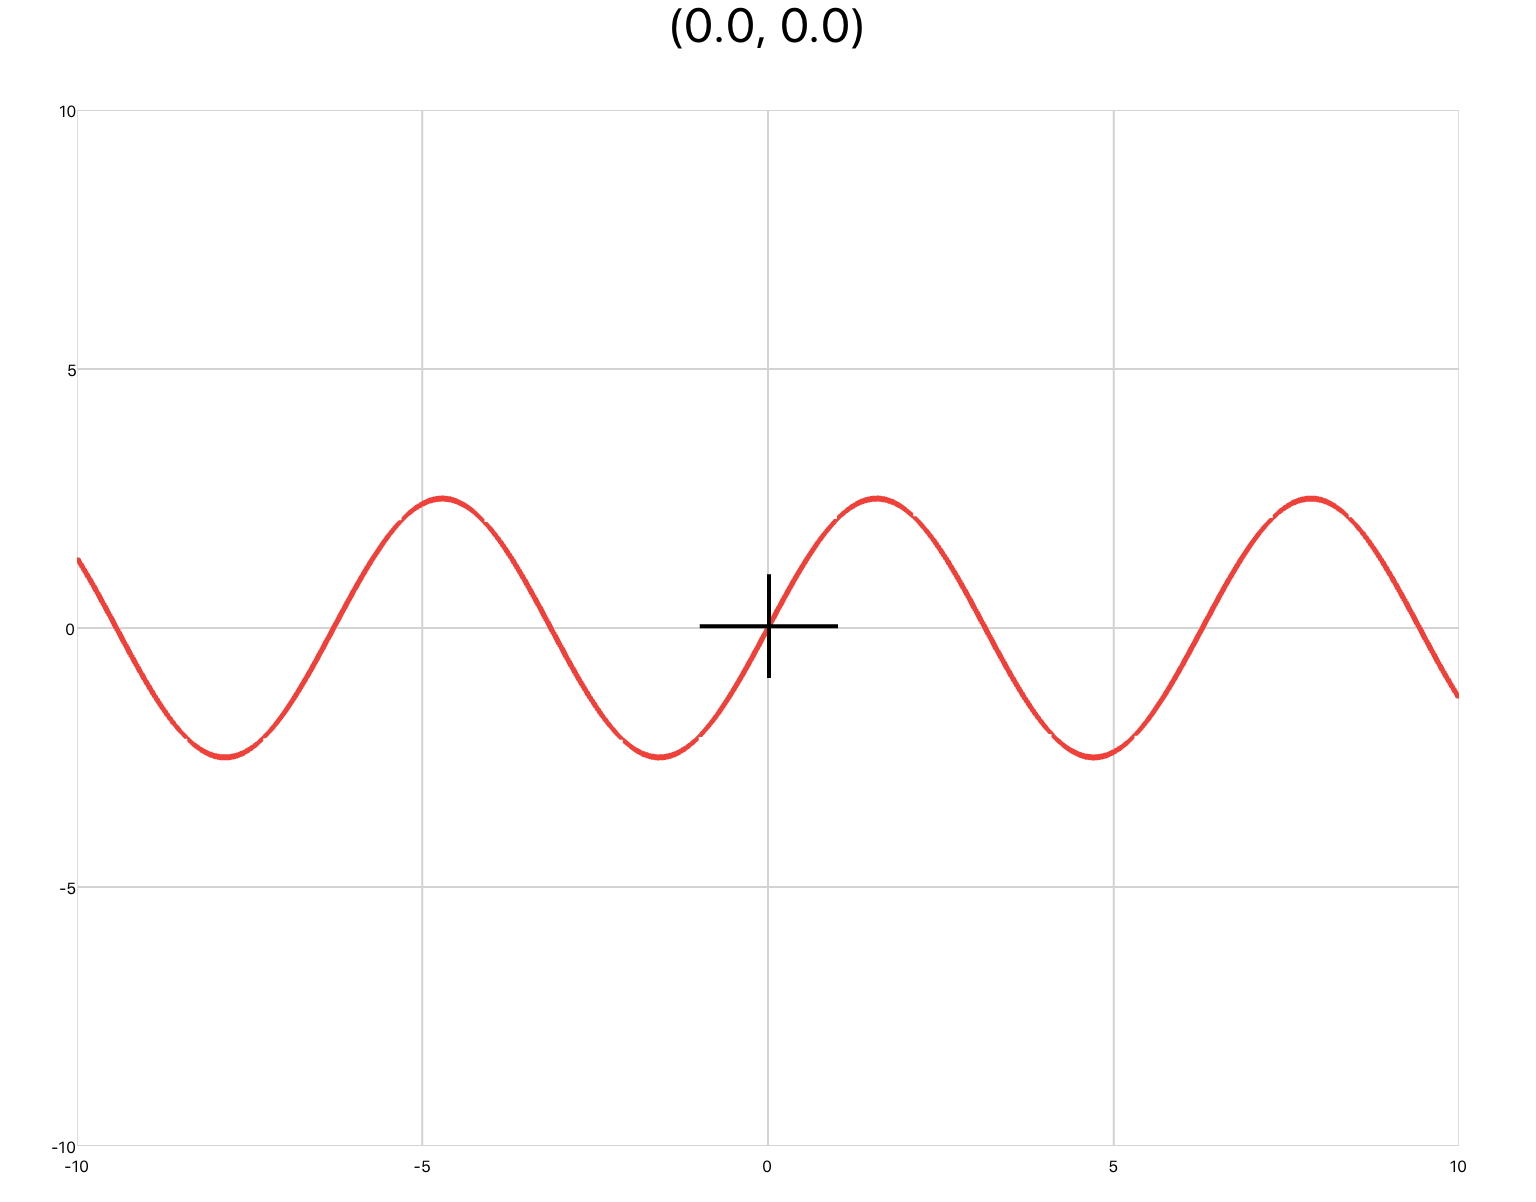
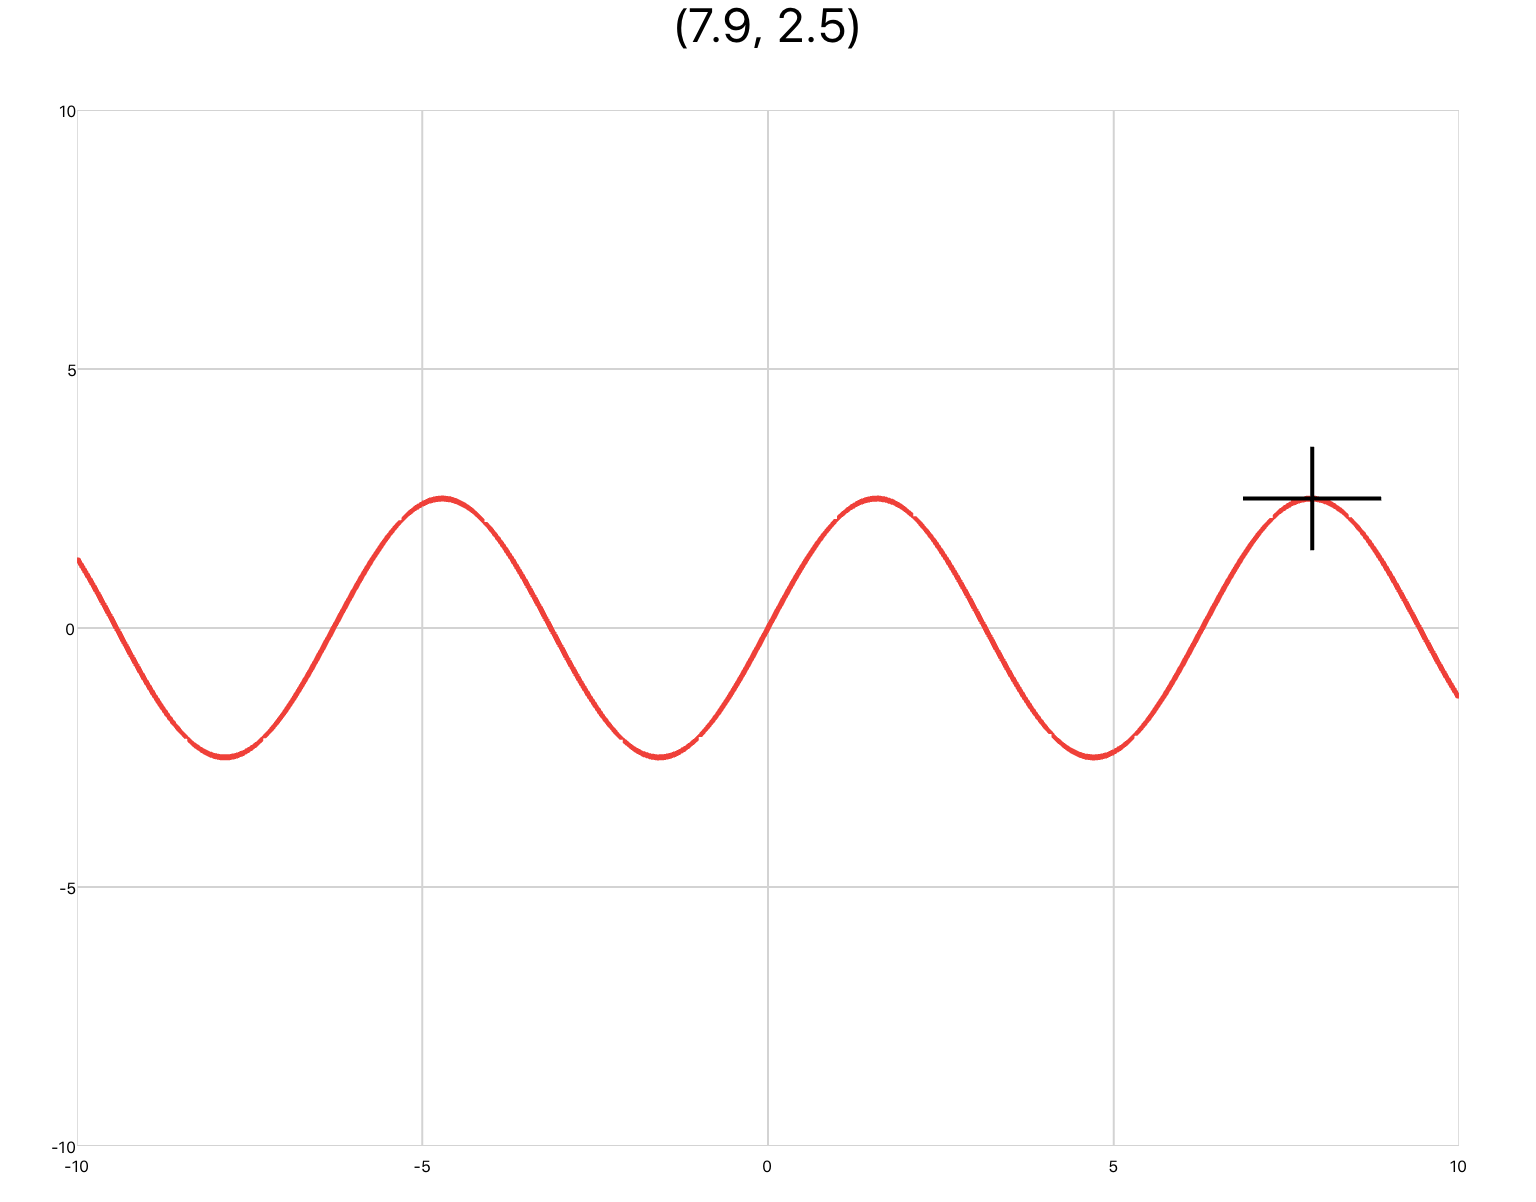
The first example uses the pan gesture to draw a cursor over the plotted curve. As your finger moves along the x-axis the cursor is drawn.
<script>
  for x = -10,10,0.1 do
  y = 2.5*math.sin(x)
  myPlot.curve:Add(x,y)
  end
</script>

<p name="cursorLabel">
  <style>
    <textAlignment>center</textAlignment>
    <size scale="large" />
  </style>
</p>

<xyPlot name="myPlot" pan="custom">
  <axis dim="x" auto="fixed" min="-10" max="10" />
  <axis dim="y" auto="growOnly" min="-10" max="10" />
  <onPan>
    local x = myPlot.XAxis.Min + state.Current.X * (myPlot.XAxis.Max - myPlot.XAxis.Min);

    y = 2.5*math.sin(x)

    cursor:Add(x-1,y)
    cursor:Add(x+1,y)
    cursor:Add(x,y-1)
    cursor:Add(x,y+1)

    cursorLabel.Text = string.format("(%0.1f, %0.1f)", x, y)
  </onPan>
  <series name="curve">
    <style>
      <lineThickness>3</lineThickness>
    </style>
  </series>
  <series name="cursor" draw="lineSegments" capacity="4">
    <style>
      <foreground color="black" />
      <lineThickness>2</lineThickness>
    </style>
  </series>
</xyPlot>
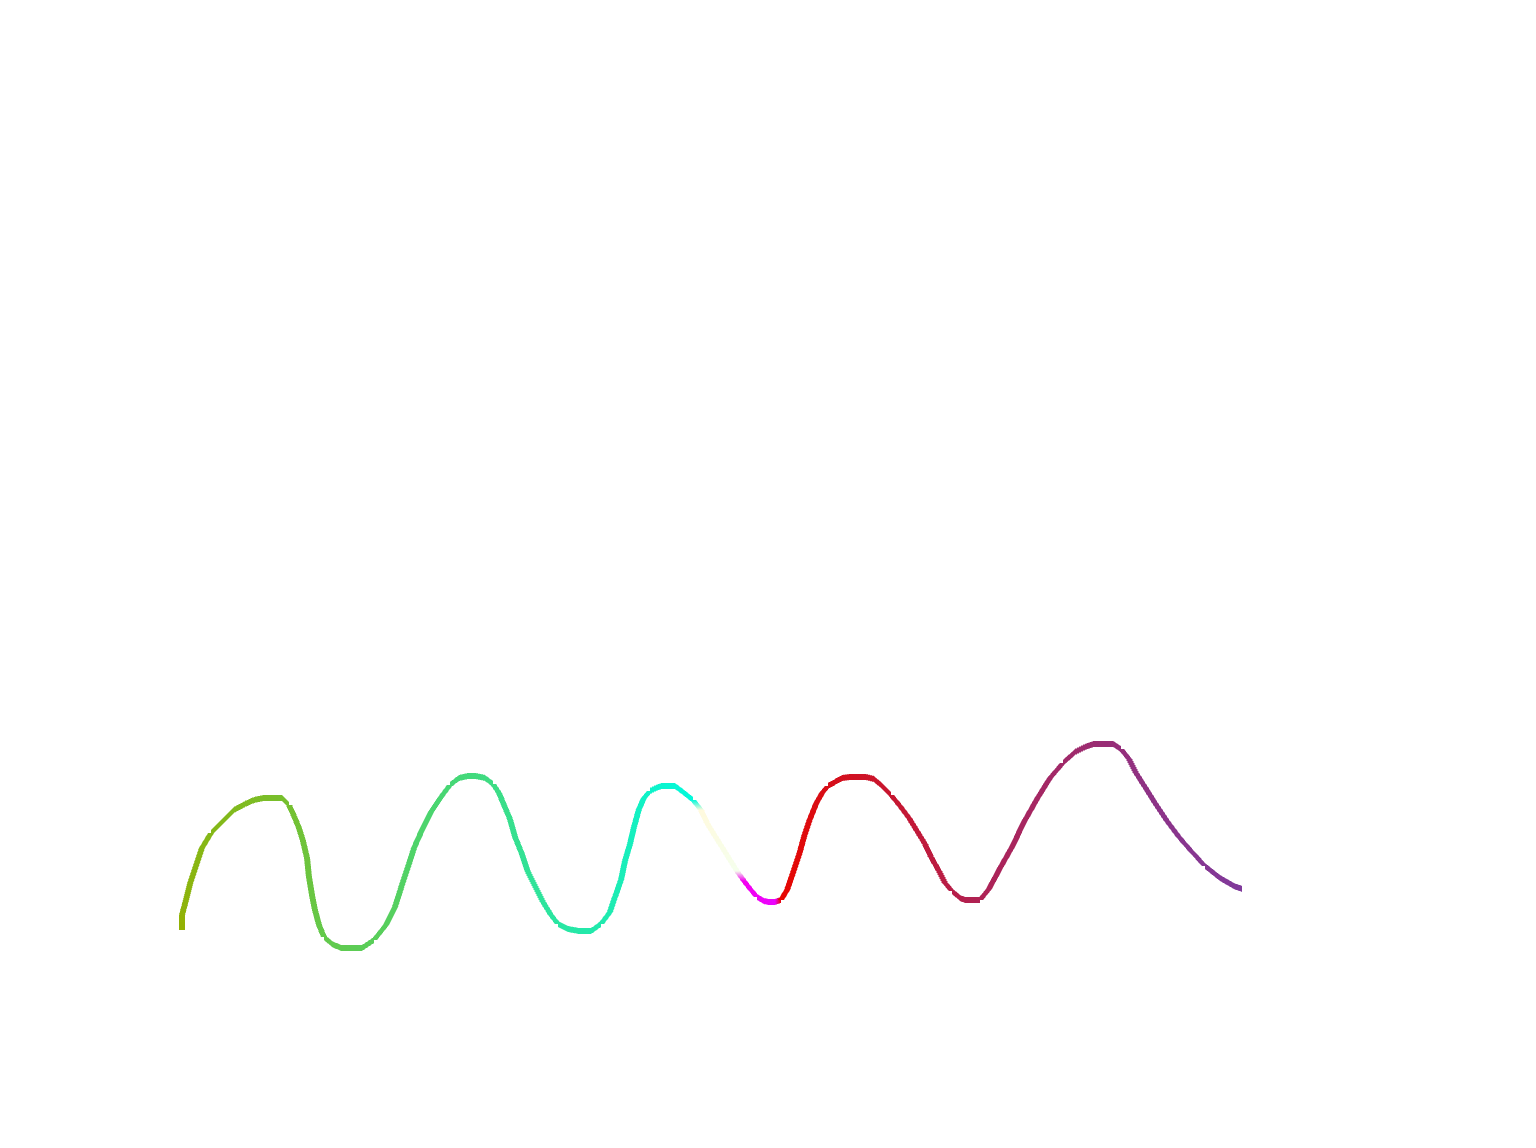
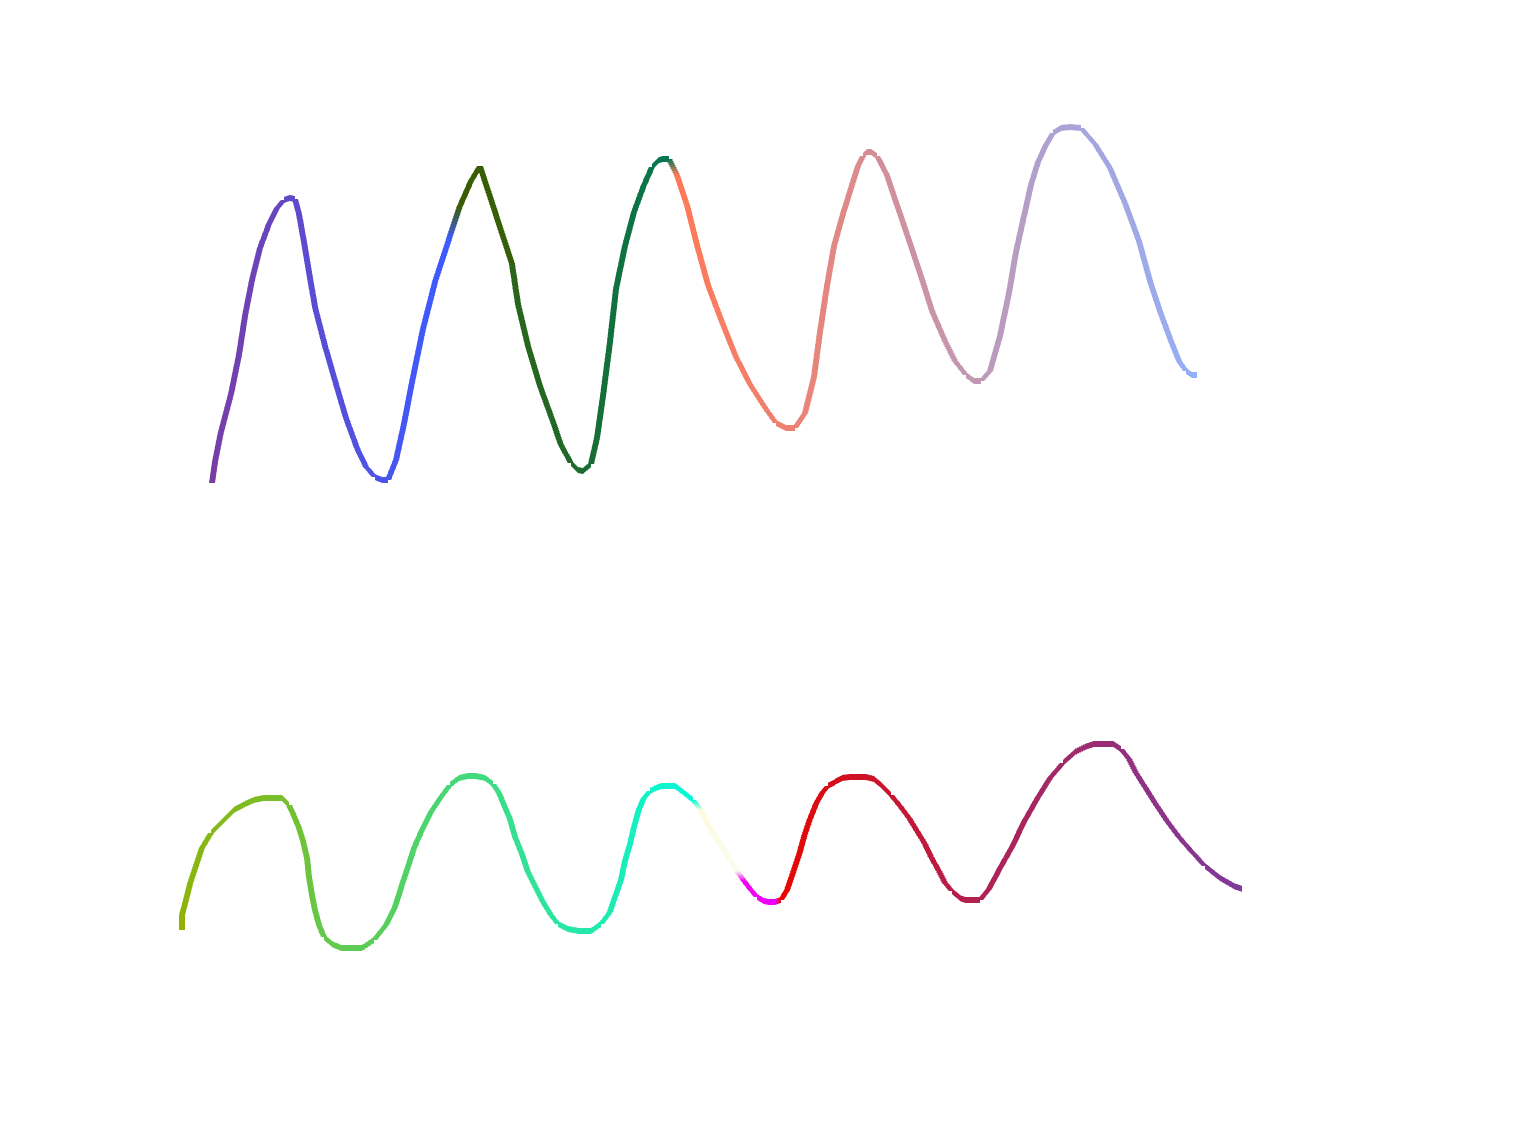
In this next example the pan gesture is used to draw on a plot. A function is used to update the color of each point that is drawn.
<script>
  <![CDATA[
  local red = 255
  local green = 0
  local blue = 0
  local myColor = color.rgb(red, green, blue)

  function updateColor()
  red = red - 2
  if red < 2 then red = 255 end
  green = green + 1
  if green > 255 then green = 0 end
  blue = blue + 3
  if blue > 255 then blue = 0 end
  myColor = color.rgb(red, green, blue)
  end
  ]]>
</script>

<drawing name="panPlot" pan="custom" manual="true">
  <axis dim="x" min="-10" max="10" auto="fixed" />
  <axis dim="y" min="-10" max="10" auto="fixed" />
  <onPan>
    local x = panPlot.XAxis.Min + state.Current.X * (panPlot.XAxis.Max - panPlot.XAxis.Min);
    local y = panPlot.YAxis.Min + state.Current.Y * (panPlot.YAxis.Max - panPlot.YAxis.Min);

    if state.IsStart then
      panSeries:Add(oldX,oldY,color.transparent)
      panSeries:Add(x,y,color.transparent)
      panSeries:Add(x,y,myColor)
    else
       panSeries:Add(x,y,myColor)
    end

    oldX = x
    oldY = y
    updateColor()
  </onPan>
  <series name="panSeries" capacity="300">
    <style>
      <lineThickness>3</lineThickness>
    </style>
  </series>
</drawing>
The transparent points are added to separate the drawn lines from each other.

Zoom
The zoom gesture is a little different than the pan and tap gestures in that it does not return coordinates. The values returned represent x and y scale factors, and can be accessed using the inherent variables x and y in the onZoom event.
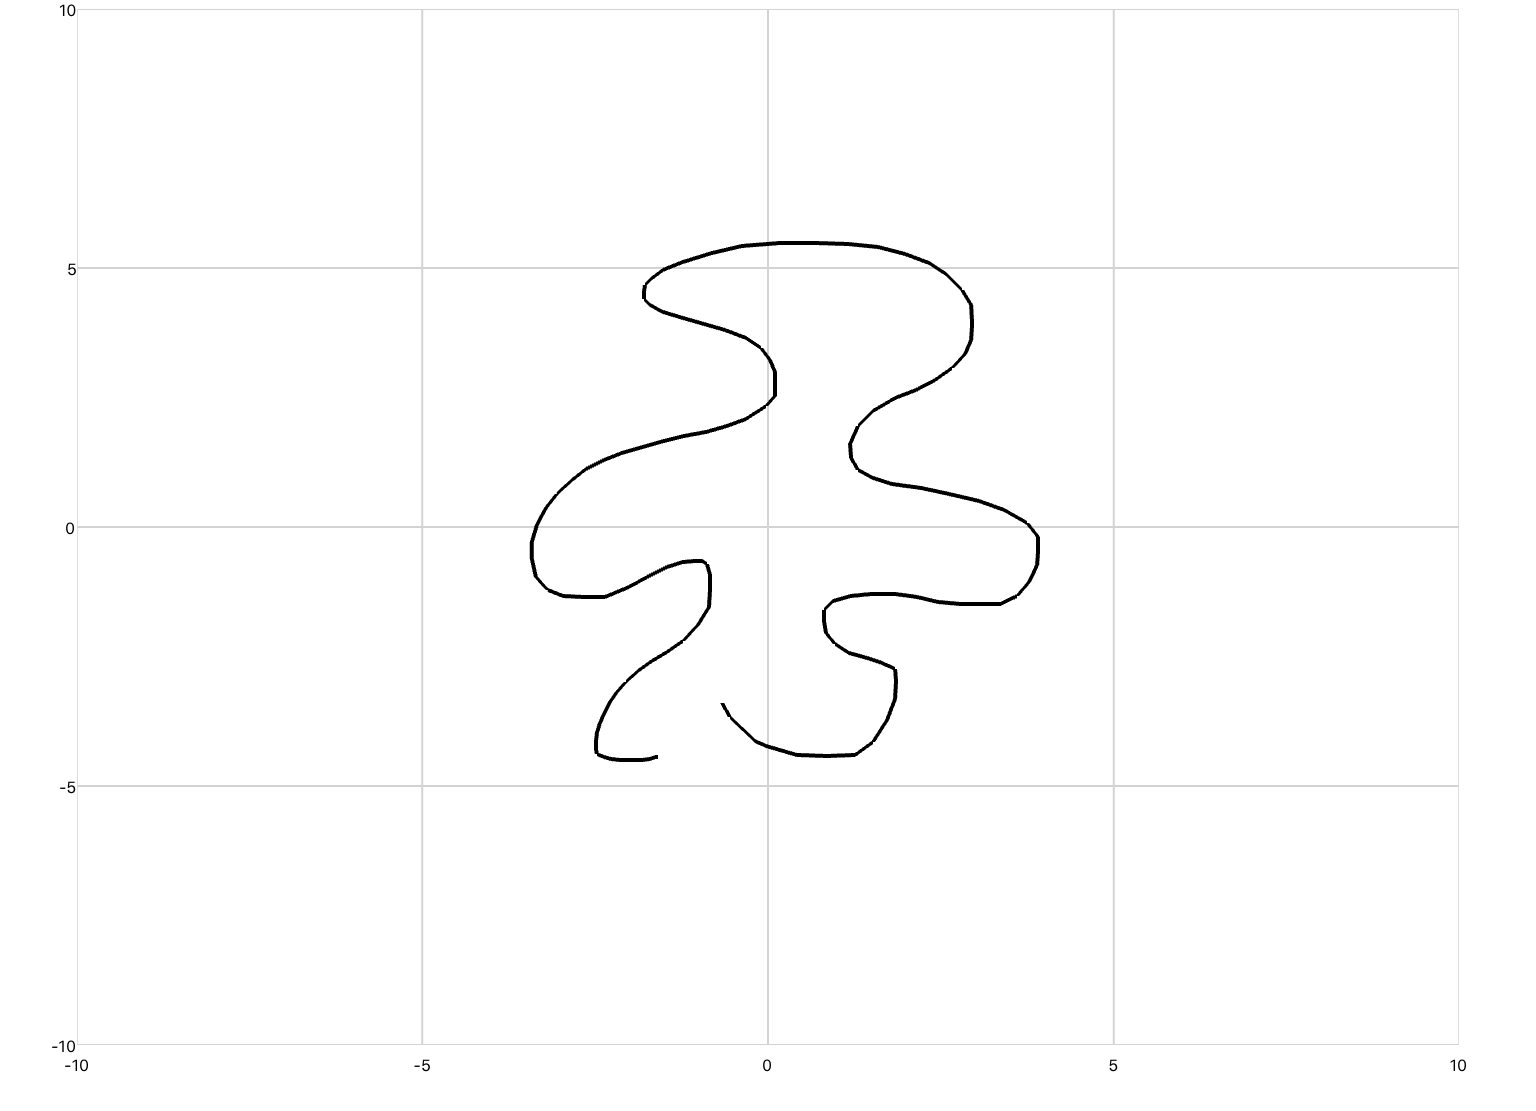
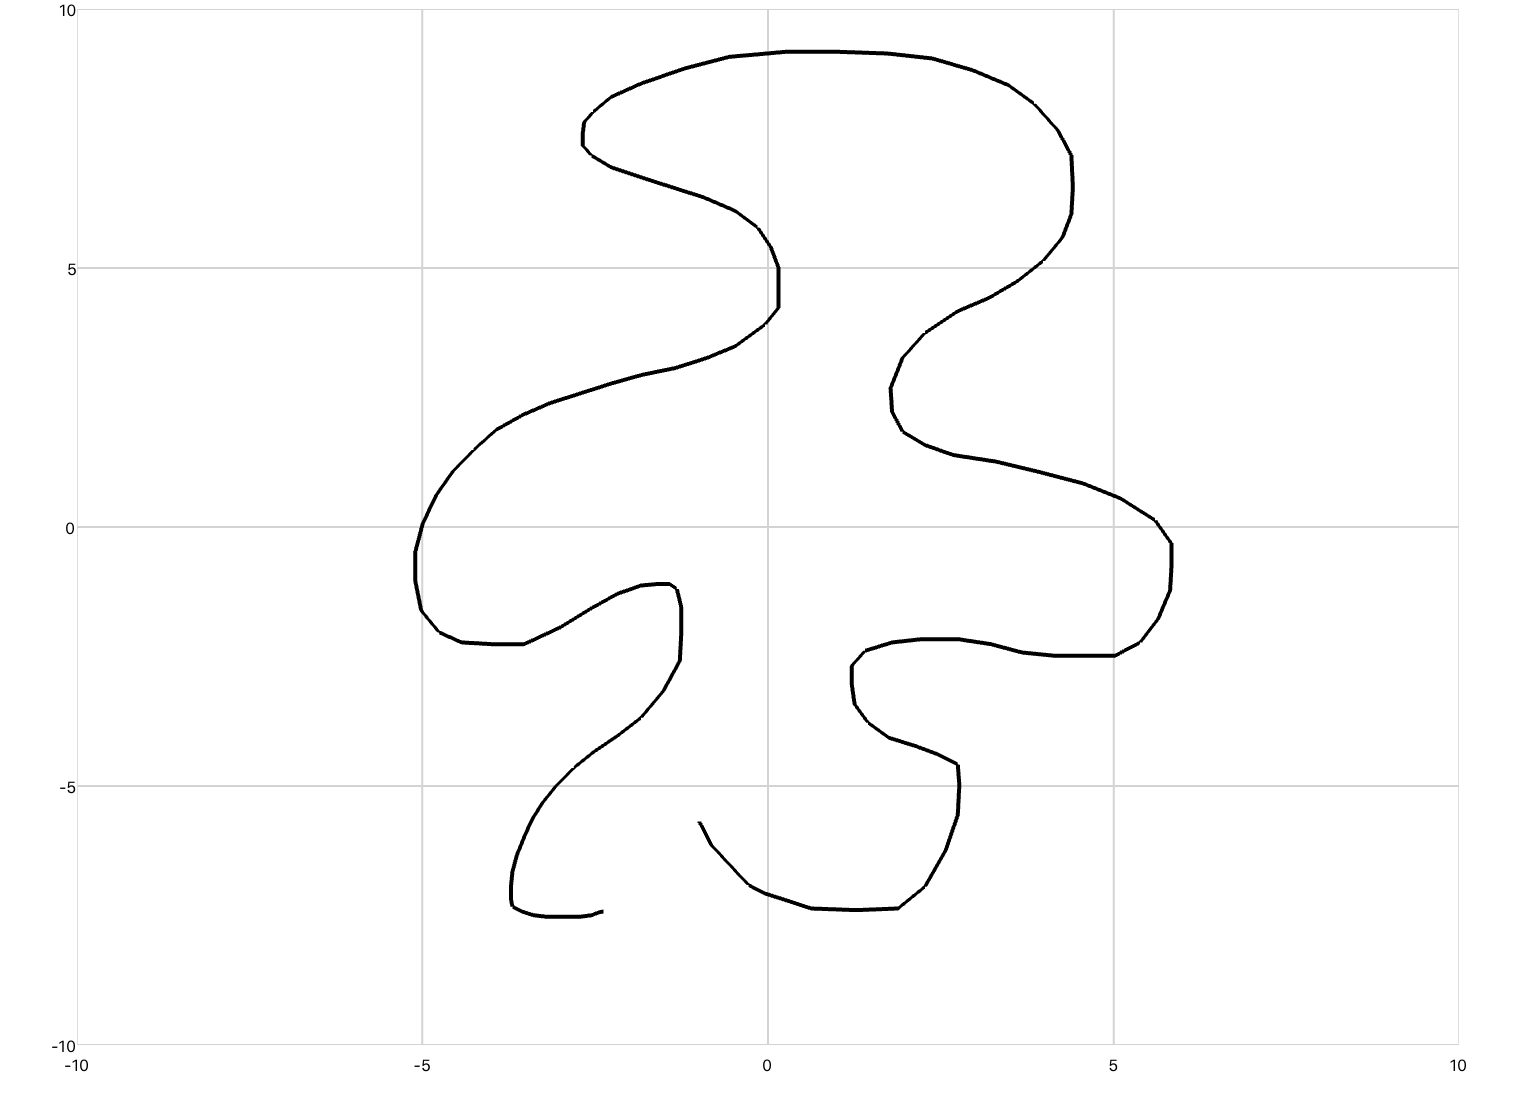
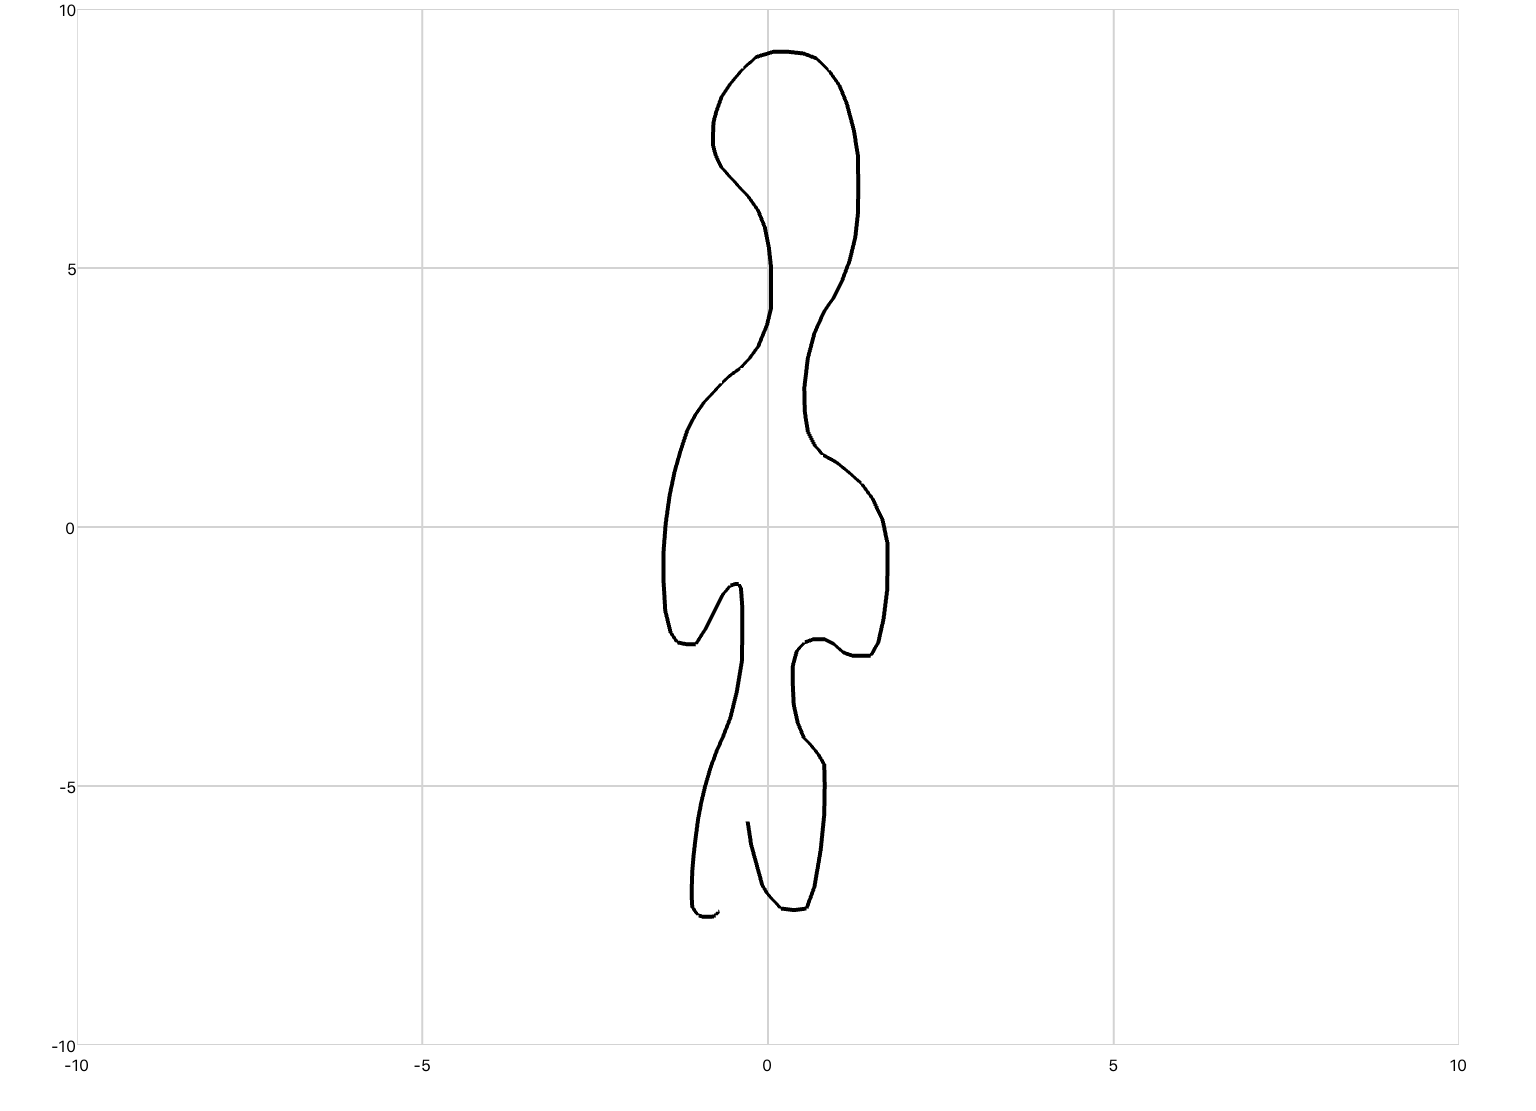
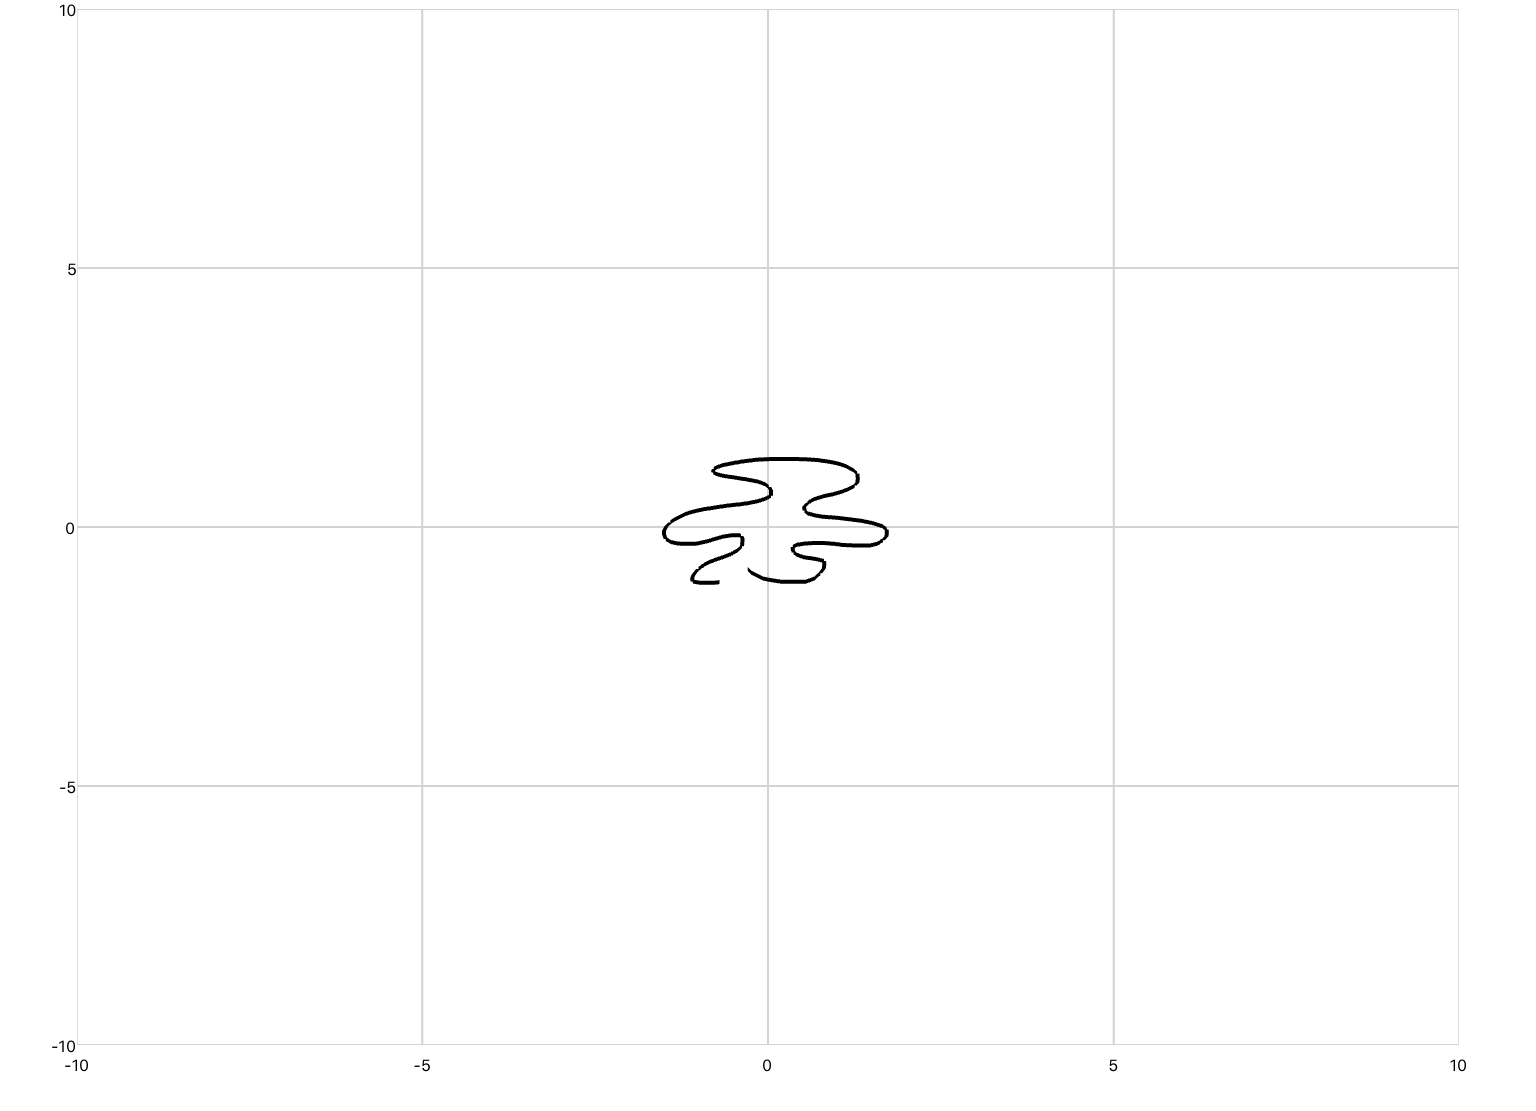
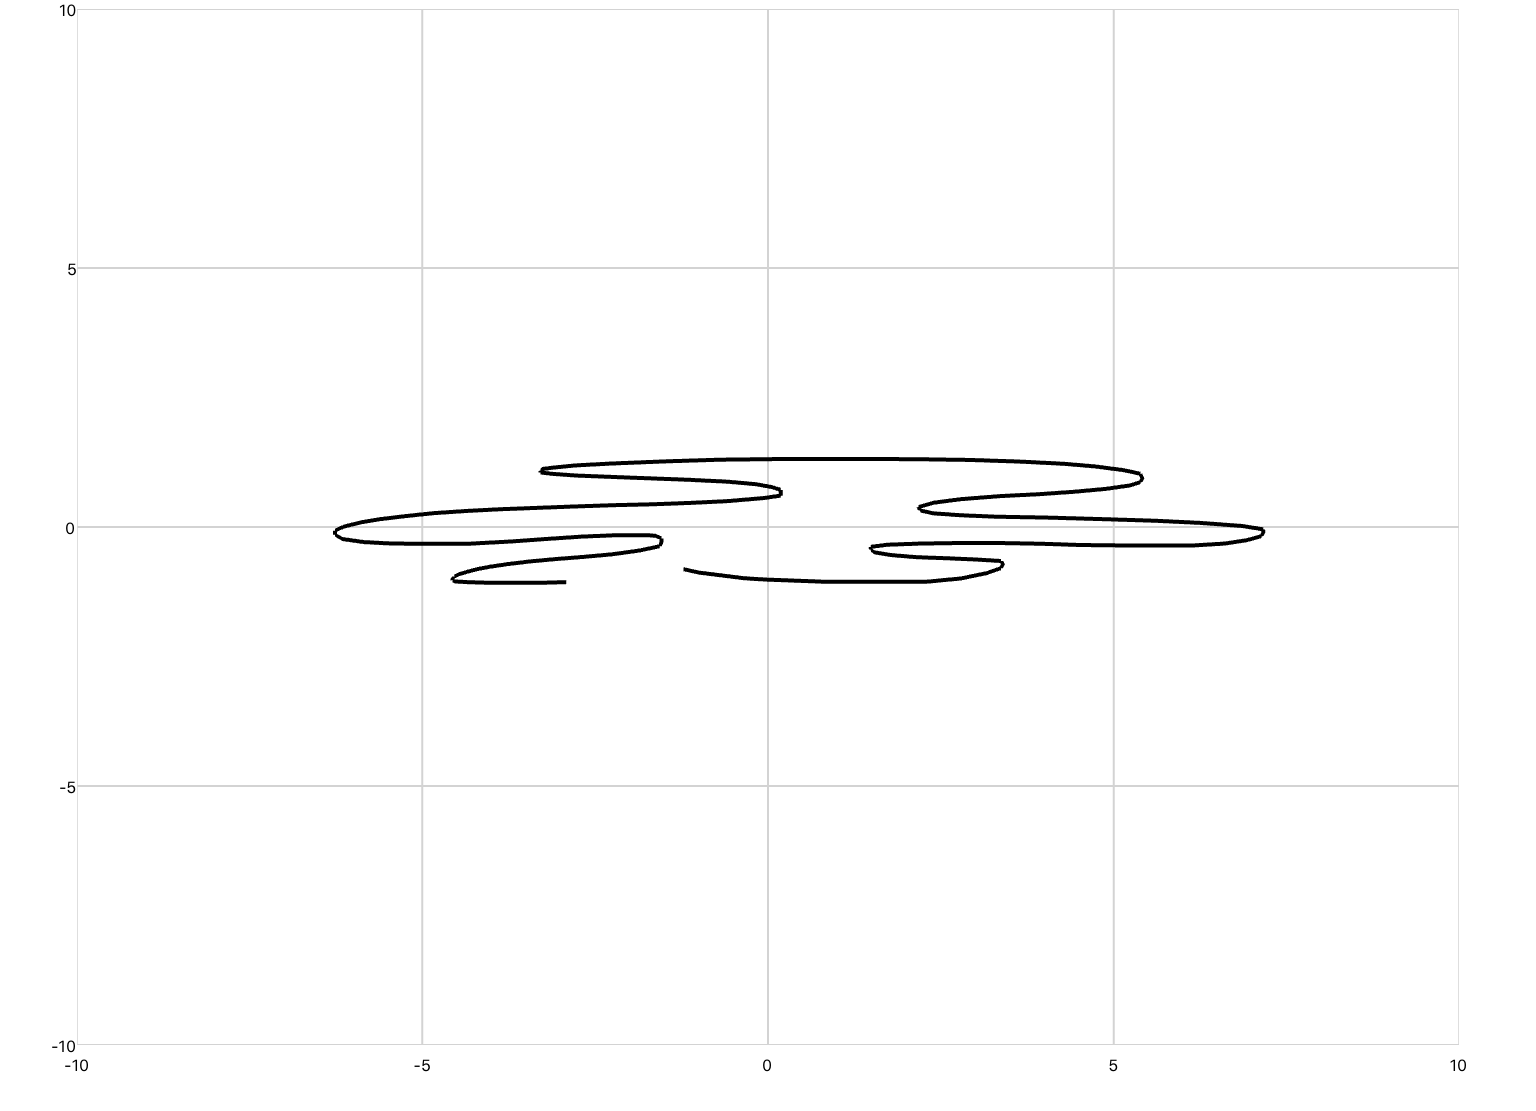
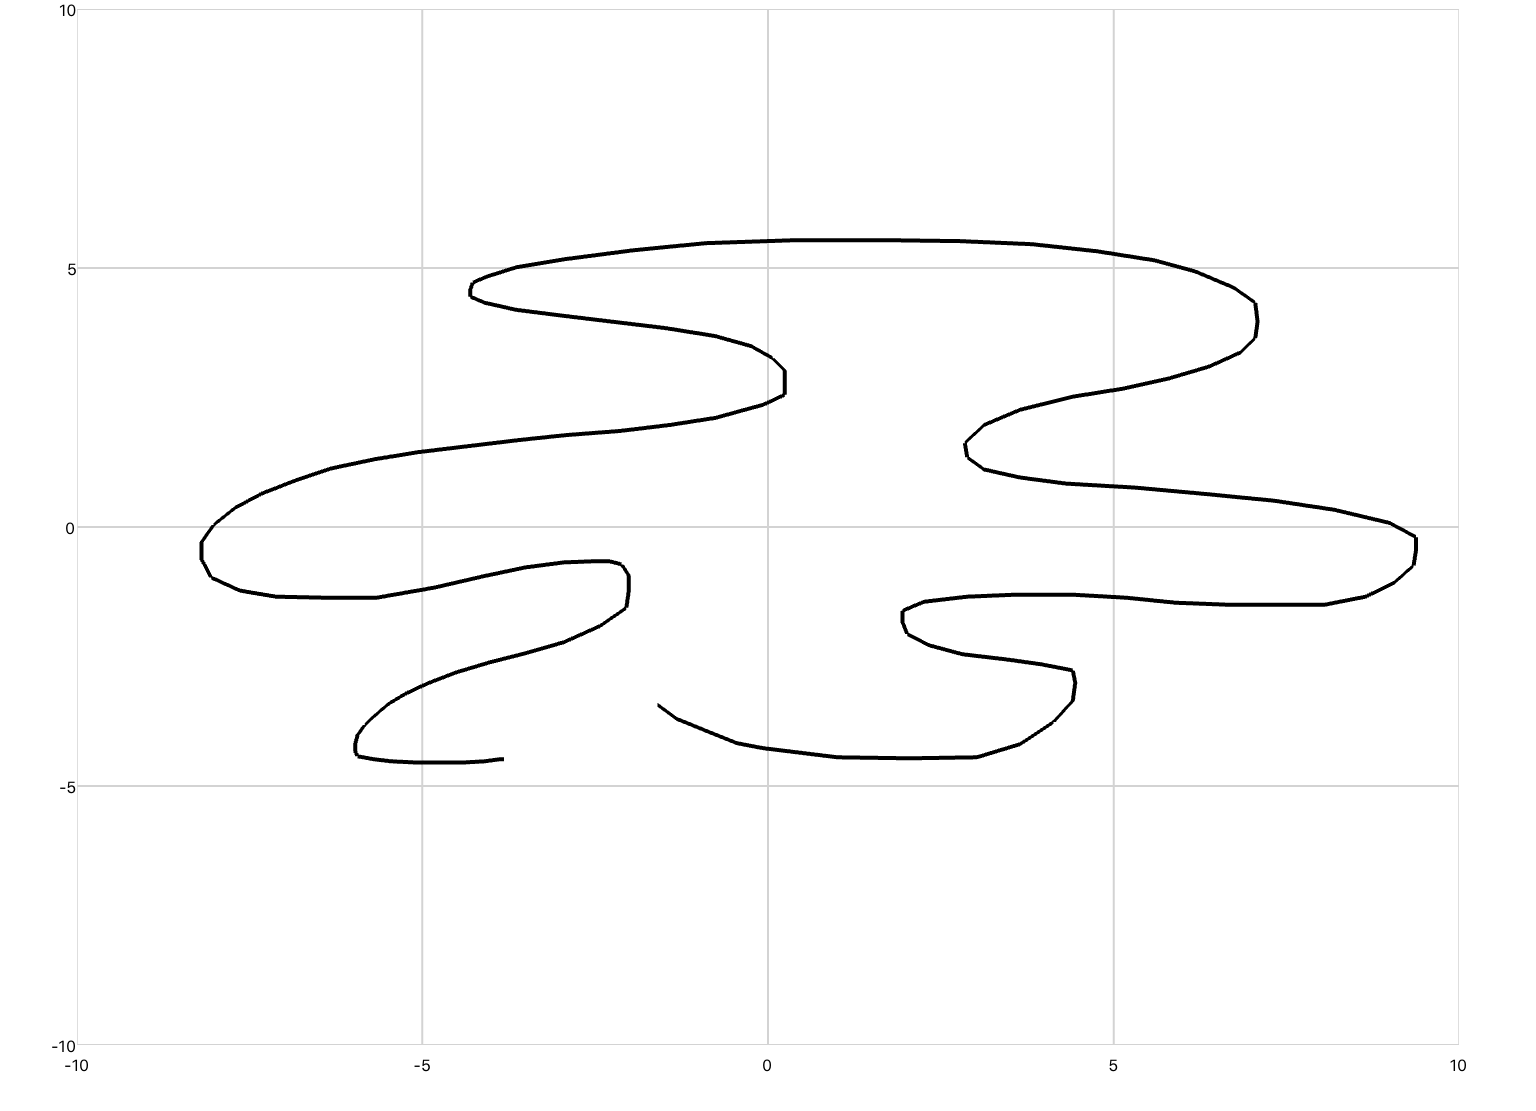
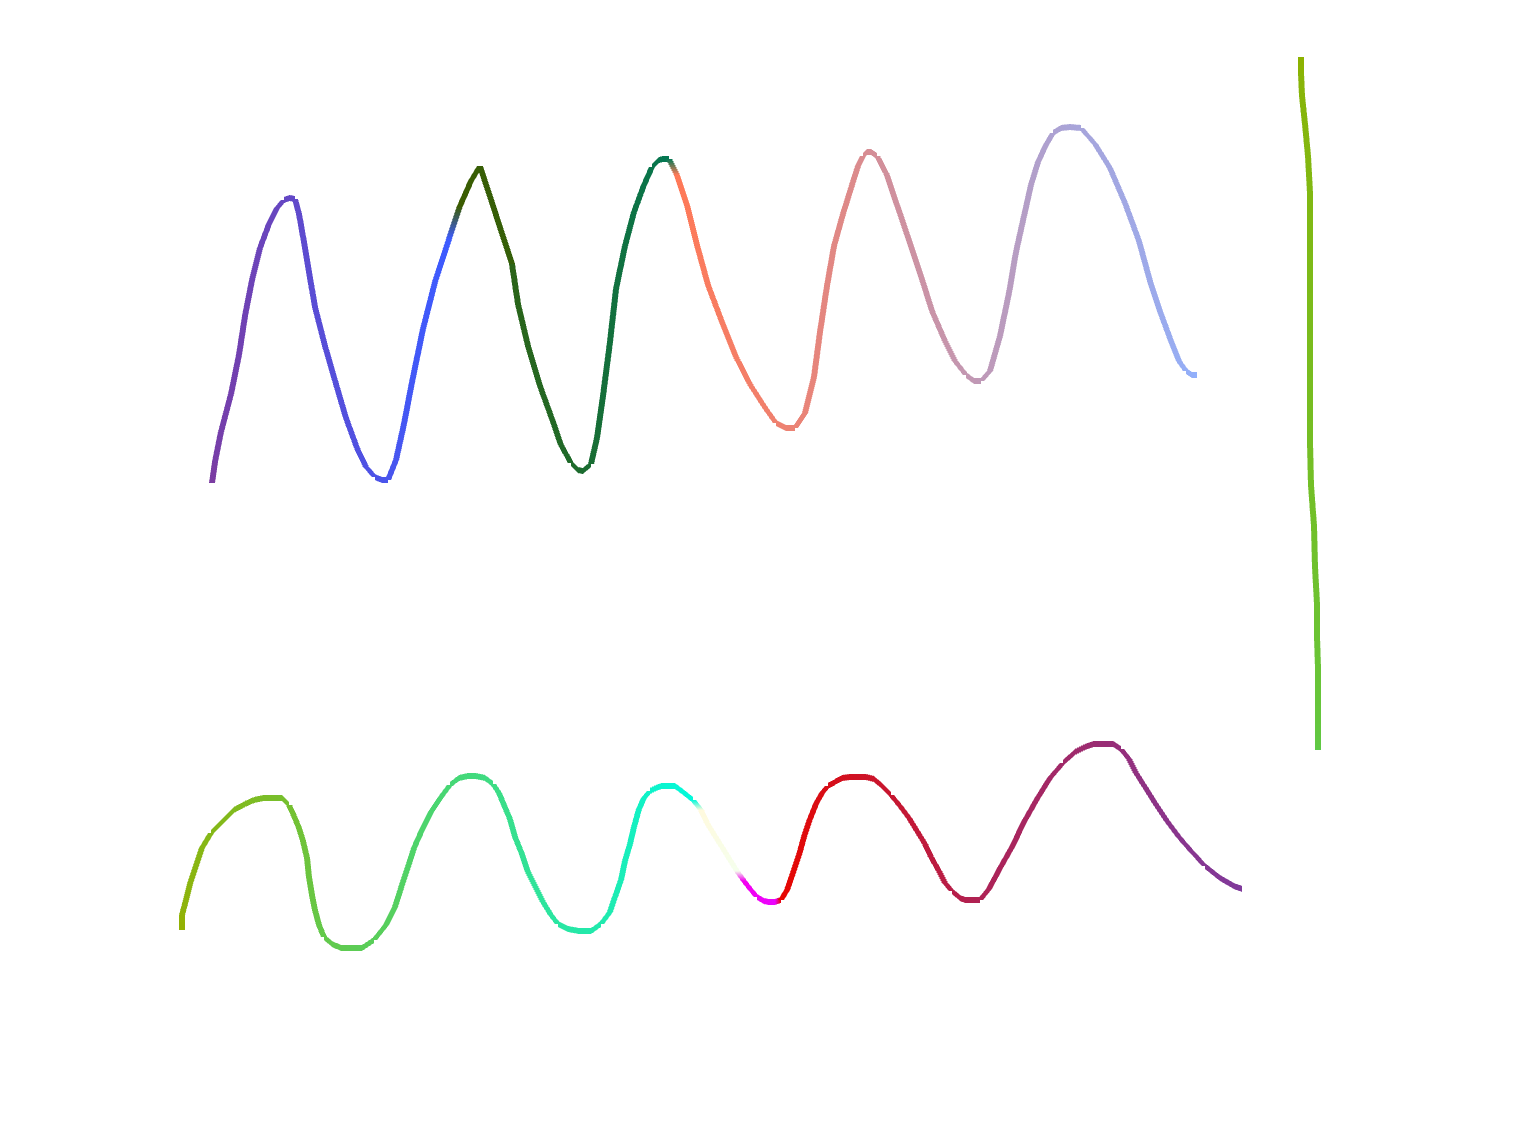
In this example the pan gesture is used to draw on a plot. The zoom gesture can then be used to resize the drawn object through matrix transforms.
<script>
  <![CDATA[
  local deltaX = 1
  local deltaY = 1

  local minX = 0
  local maxX = 0
  local minY = 0
  local maxY = 0

  function findMinMax(x,y)
    if x < minX then minX = x end
    if x > maxX then maxX = x end
    if y < minY then minY = y end
    if y > maxY then maxY = y end
  end
  ]]>
</script>

<xyPlot name="thisPlot" zoom="custom" pan="custom">
  <axis dim="x" min="-10" max="10" auto="fixed" />
  <axis dim="y" min="-10" max="10" auto="fixed" />
  <onPan>
    <![CDATA[
    local a = thisPlot.XAxis.Min + state.Current.X * (thisPlot.XAxis.Max - thisPlot.XAxis.Min);
    local b = thisPlot.YAxis.Min + state.Current.Y * (thisPlot.YAxis.Max - thisPlot.YAxis.Min);

    drawSeries:Add(a,b)
    findMinMax(a,b)
    ]]>
  </onPan>
  <onZoom>
    <![CDATA[
    x = x - 1;
    y = y - 1;

    if y ~= 0 then
    deltaY = deltaY + ( y * (maxY - minY));
    if deltaY < 0.1 then deltaY = 0.1 end
    end

    if x ~= 0 then
    deltaX = deltaX + ( x * (maxX - minX));
    if deltaX < 0.1 then deltaX = 0.1 end
    end

    drawSeries.Transform = matrixf.scaling(deltaX, deltaY, 1)
      ]]>
  </onZoom>
  <series name="drawSeries">
    <style>
      <foreground color="black" />
      <lineThickness>2</lineThickness>
    </style>
  </series>
</xyPlot>