
Gyroscope
Gyroscopes can be used to find the speed of rotation of a device. You can access this data using the gyroscope tag. Rotation speeds are output in units of radians per second.
The gyroscope data is stored inside of an inherent gyroscope vector called value inside of the onValueChanged event. As with simulations, qdex will not start to read gyroscope data until the gyroscope is started using the Start() method, or signalled from a simulation.


value[1]
Rotation around the x-axis

value[2]
Rotation around the y-axis

value[3]
Rotation around the z-axis
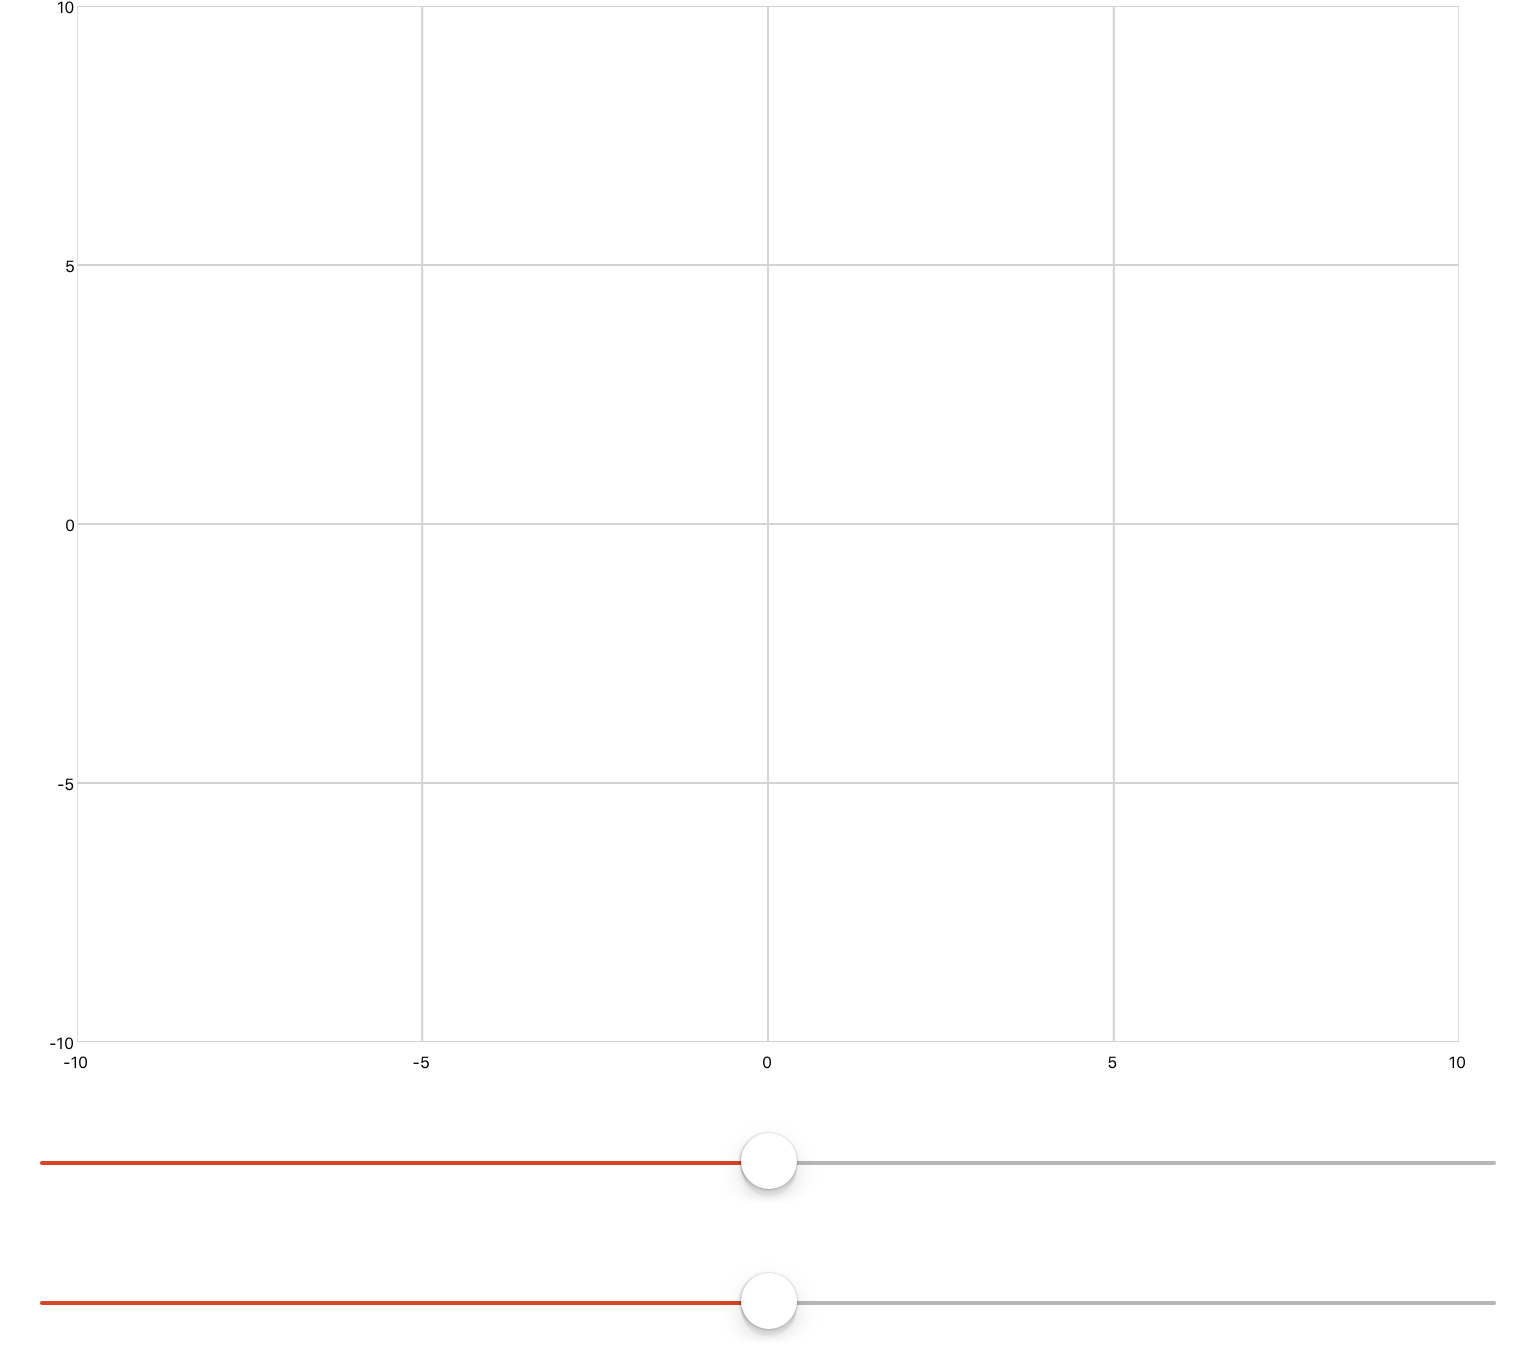
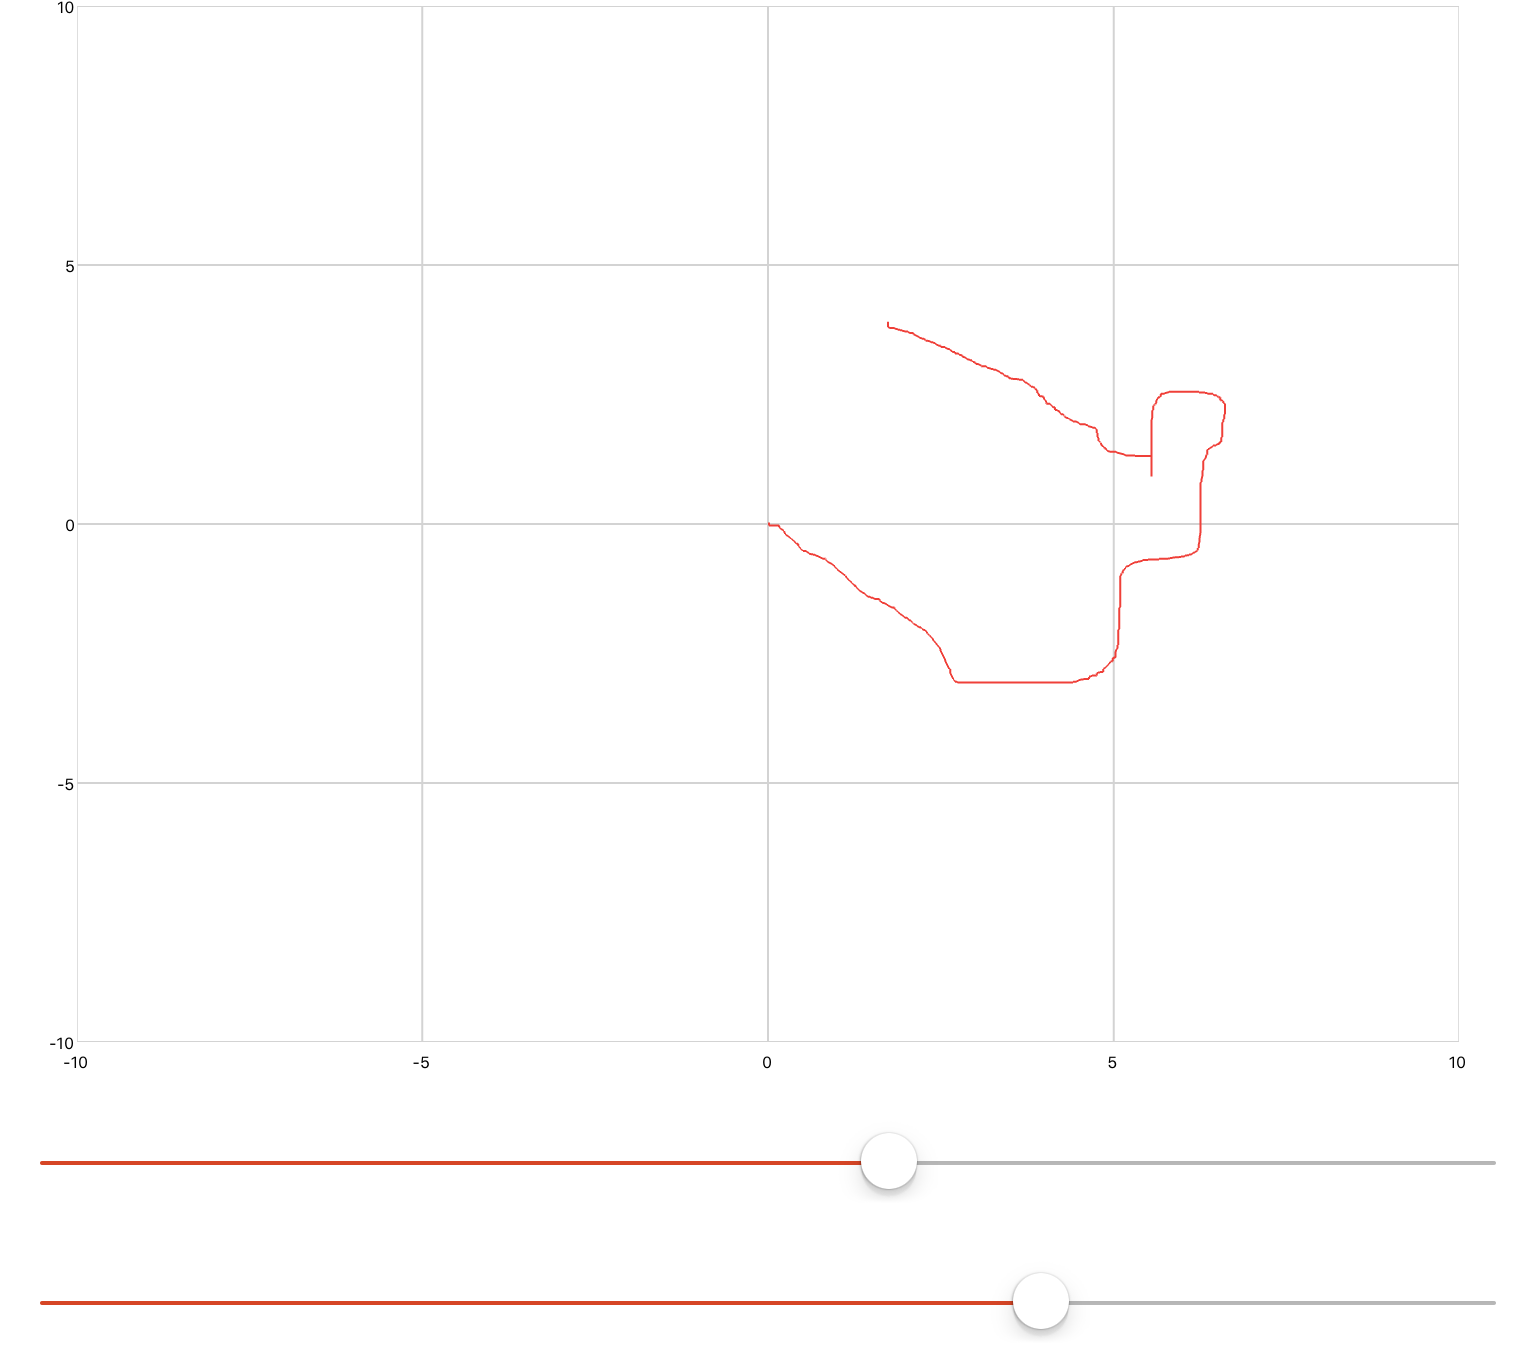
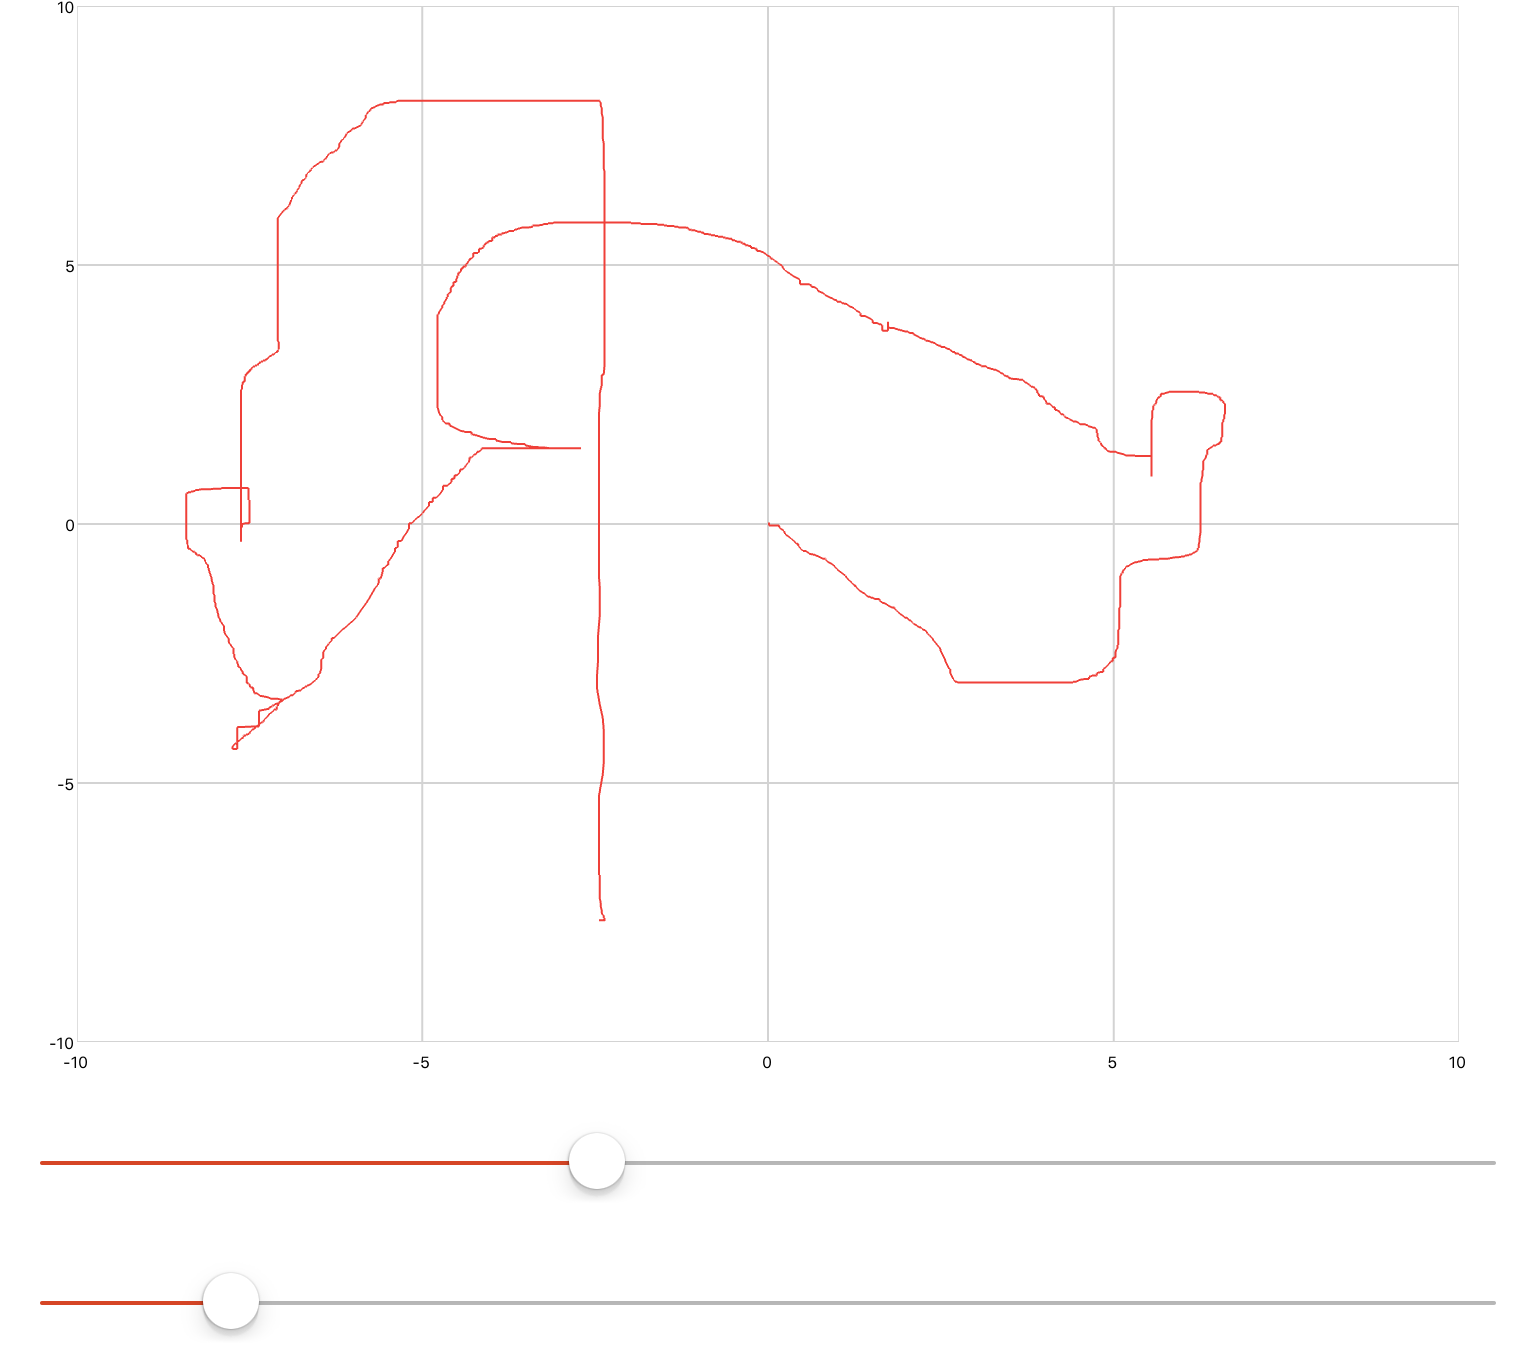
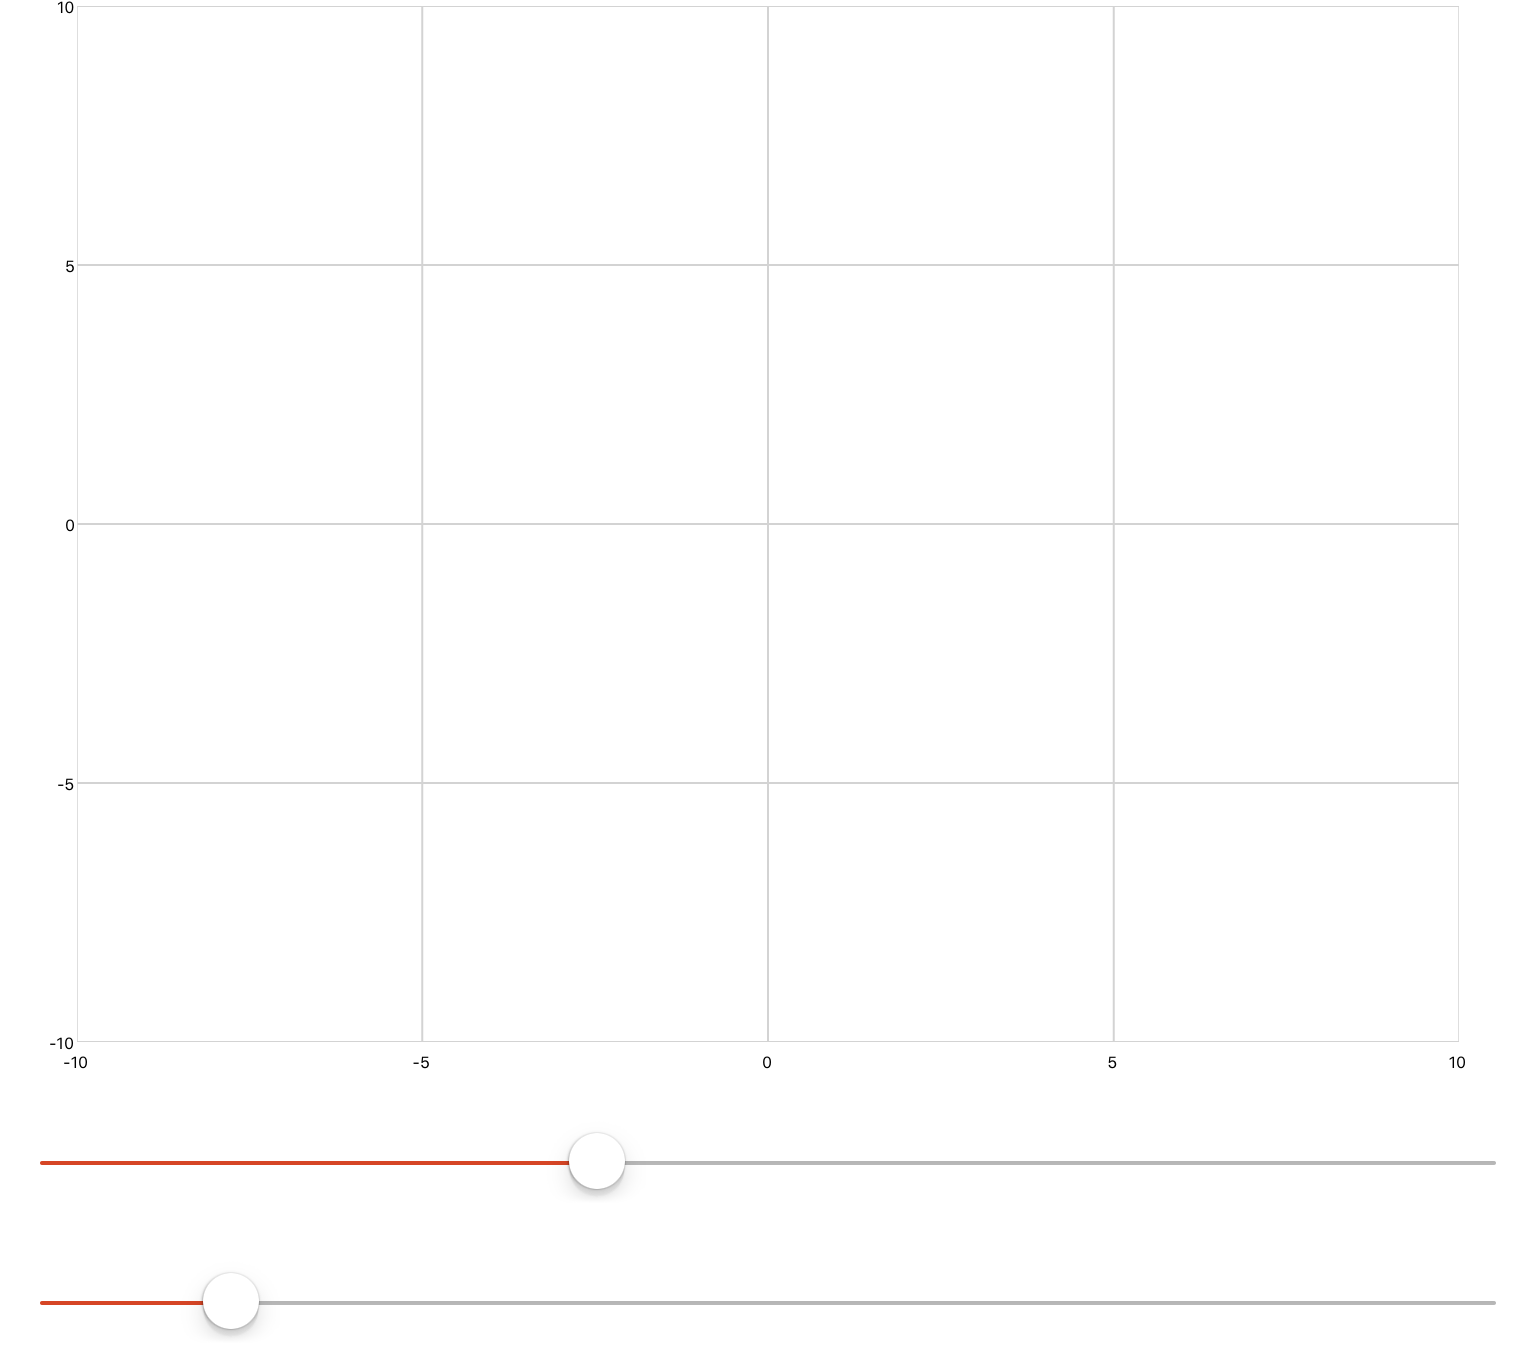
In the example below, two sliders are used to draw coordinates on a plot. When the tablet is rotated around the z-axis the drawings on the plot are cleared.
This example must be placed inside of a section called mySection in order to be used as-is.
<gyroscope name="gyro" />

<simulation name="mySim" duration="120" period="0.01">
  <onActivePageChanged>
    if active then
    mySim:Start()
    else
    mySim:Stop()
    end
  </onActivePageChanged>
  <solver>
    <series>
      <signal ref="mySection.gyro" width="3" />
      <system>
        <input name="myInput" width="3" />
        <onOutputs>
           <![CDATA[
              if myInput[3] > 10 then
                myPlot.mySeries:Clear();
              end
            ]]>
        </onOutputs>
      </system>
    </series>
  </solver>
</simulation>

<xyPlot name="myPlot">
  <axis dim="x" auto="fixed" min="-10" max="10" />
  <axis dim="y" auto="fixed" min="-10" max="10" />
  <series name="mySeries" />
</xyPlot>

<slider name="sliderX" min="-10" max="10" value="0">
  <onValueChanged>
    myPlot.mySeries:Add(value, sliderY.Value)
  </onValueChanged>
</slider>

<slider name="sliderY" min="-10" max="10" value="0">
  <onValueChanged>
    myPlot.mySeries:Add(sliderX.Value, value)
  </onValueChanged>
</slider>