
Transforms
Plot transforms allow you to move or change points on a plot while maintaining the original series, without having to manually redraw the shape. They can be specified in XML using a transformation matrix, or through Lua by setting the appropriate parameters. Alternatively, you can use the animation tools fragment to easily perform the same manipulations with less effort.
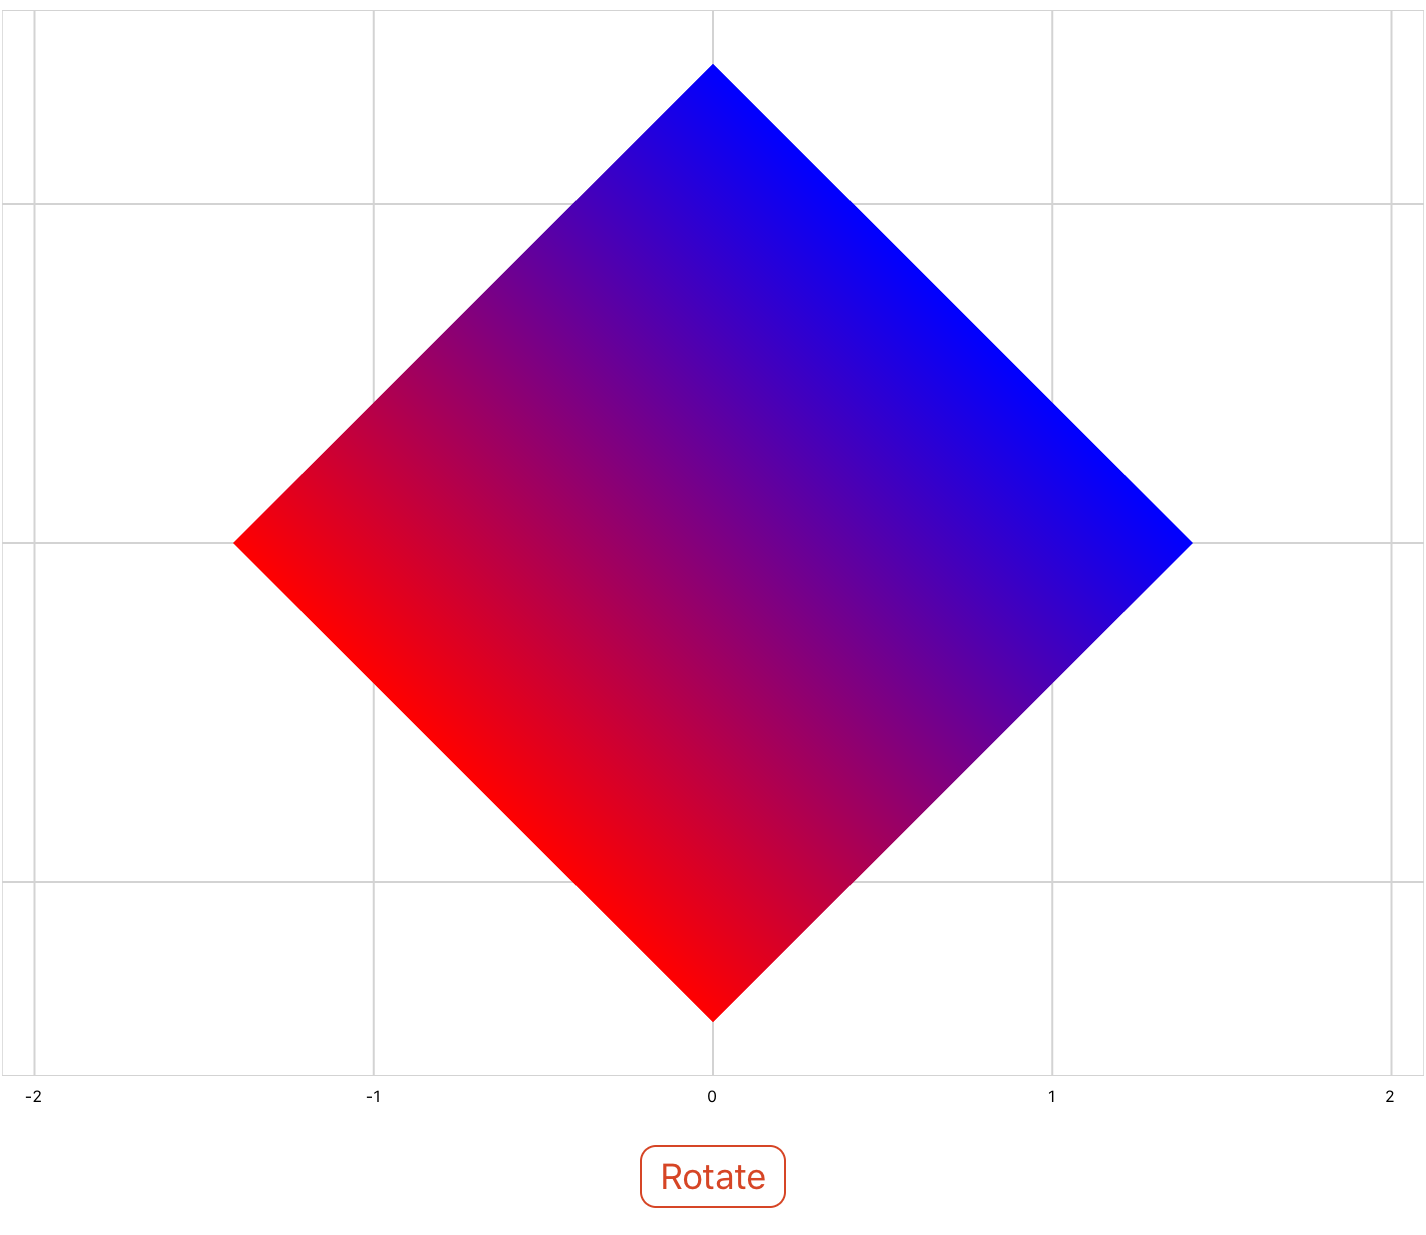
A transformation matrix can be defined in XML inside of a series by using the transform element. For example, the following code uses a transformation matrix to rotate a square 45 degrees counter-clockwise.
<drawing>
  <series draw="radialFill">
    <data>-1 -1; 1 -1; 1 1; -1 1</data>
    <transform>
        0.7071067811865476 -0.7071067811865475 0 0;
        0.7071067811865476  0.7071067811865475 0 0;
        0                   0                  1 0;
        0                   0                  0 1
    </transform>
  </series>
</drawing>

From Lua you can use the Transform property of a series to rotate, translate, scale and reflect shapes without having to define a transformation matrix. See below.
Rotation
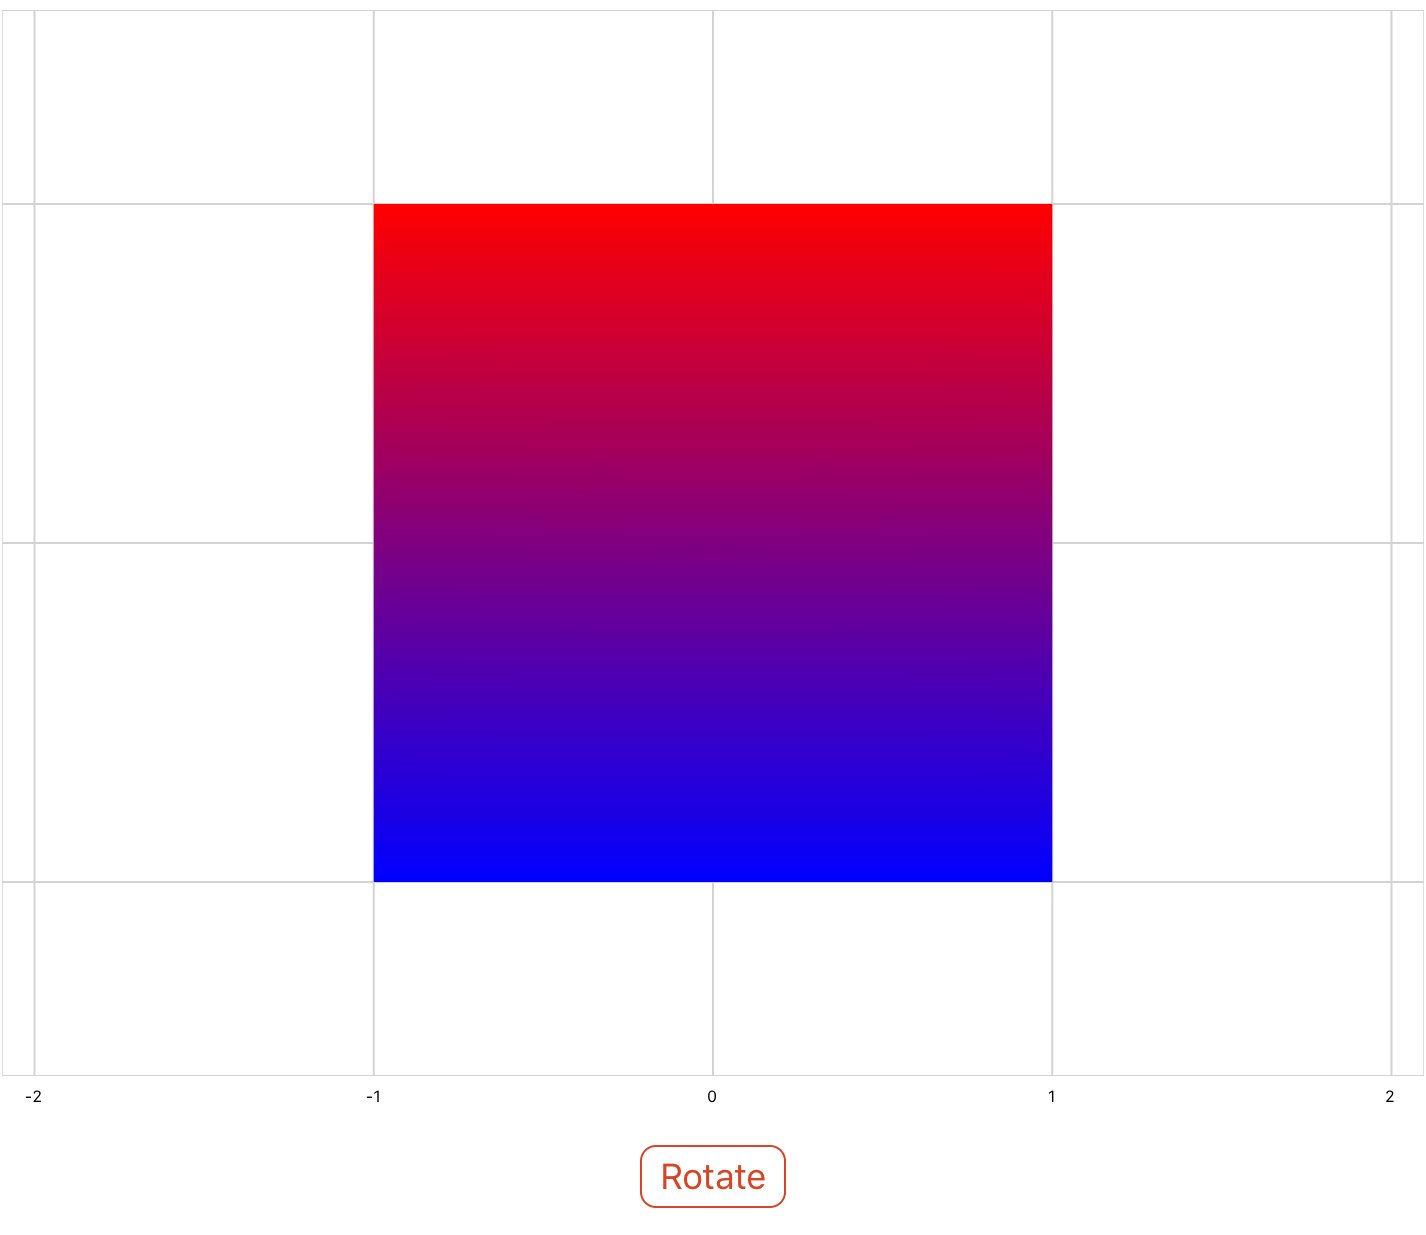
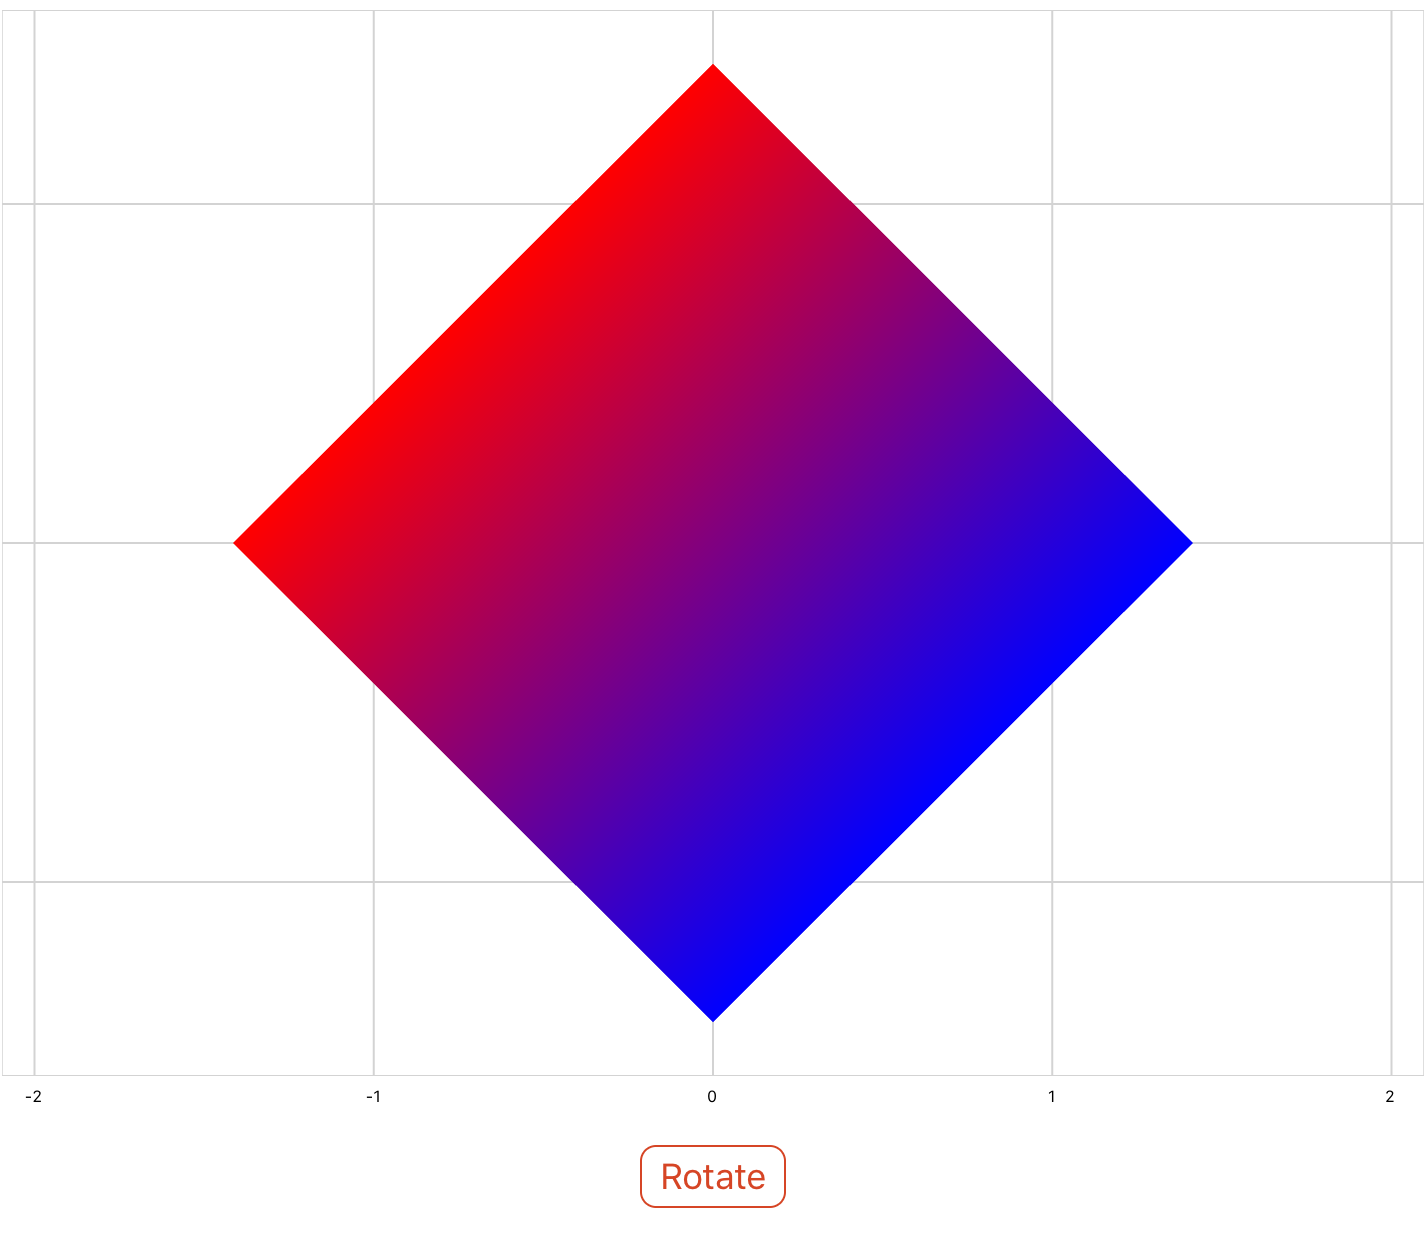
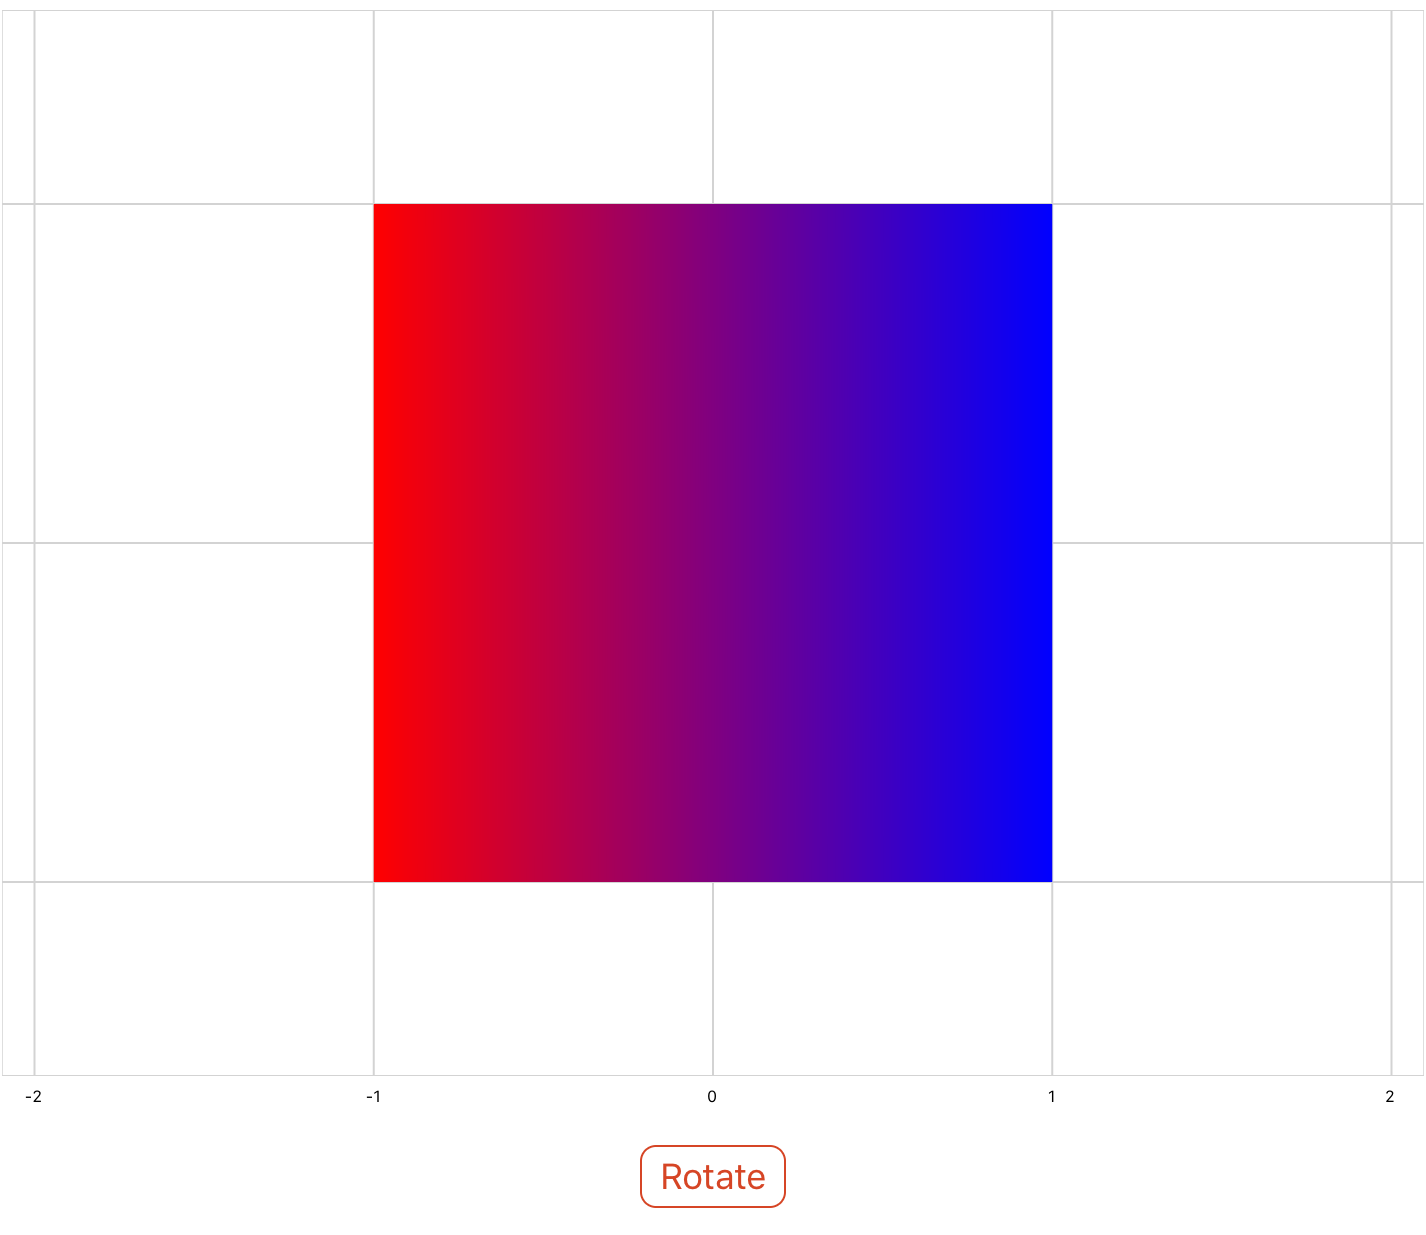
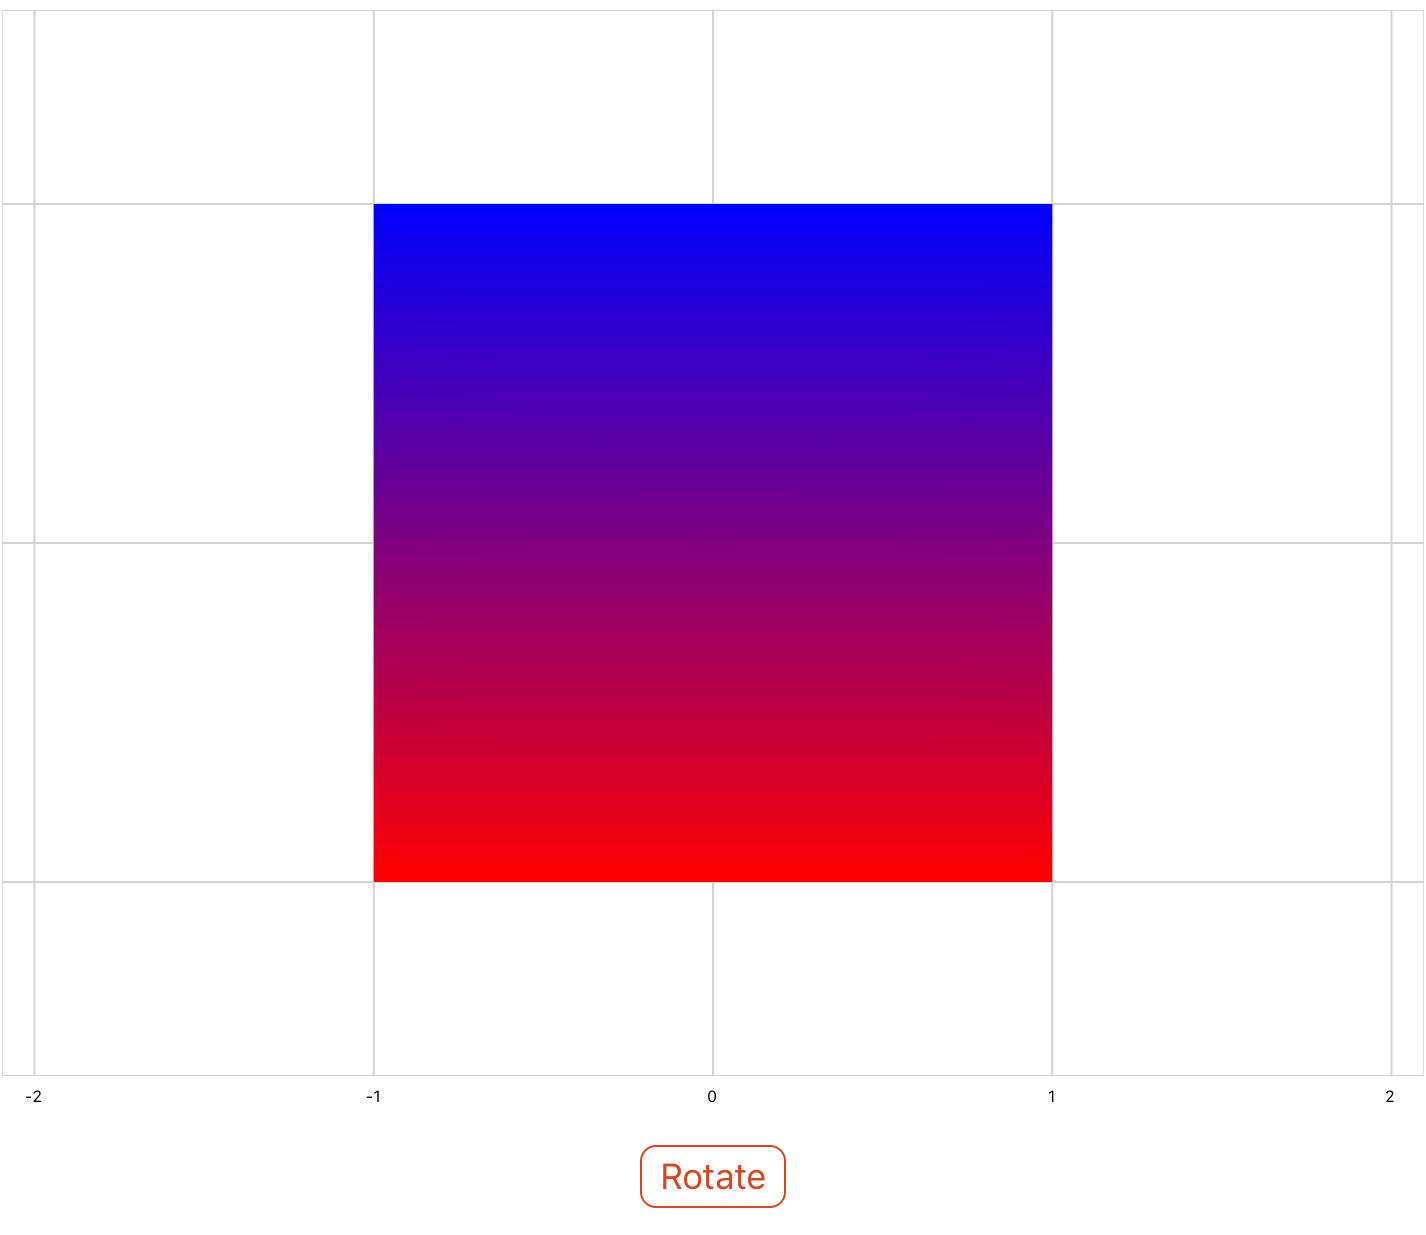
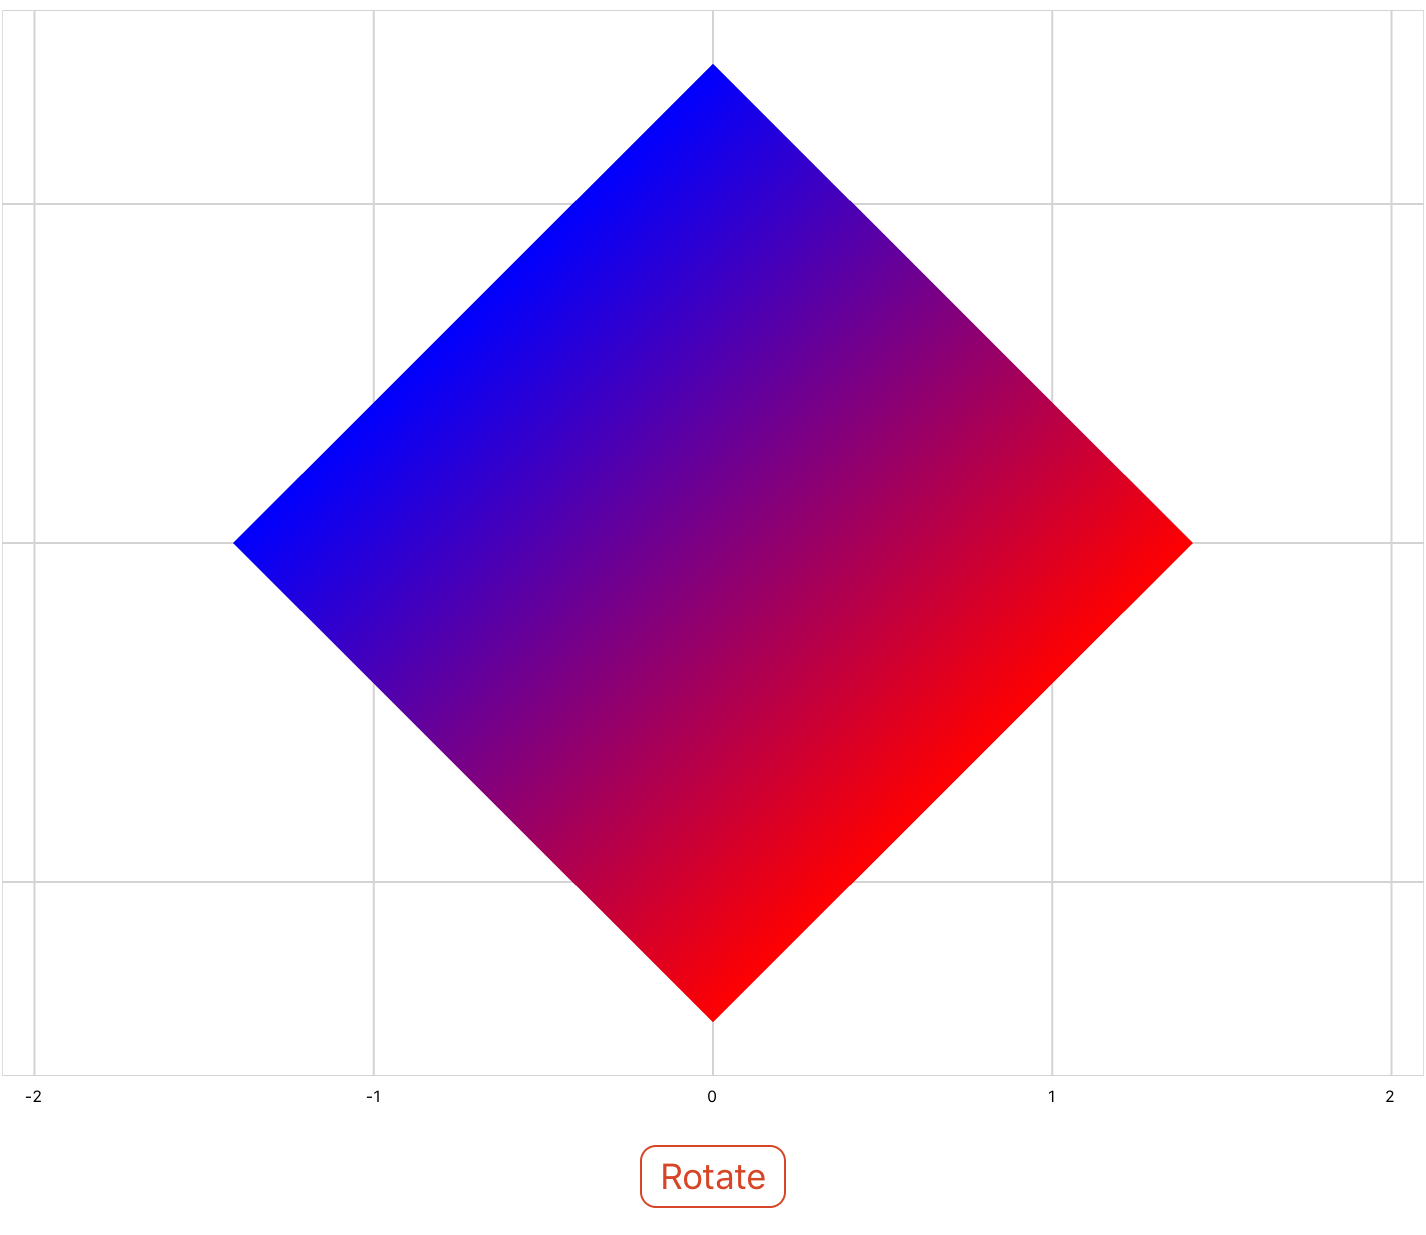
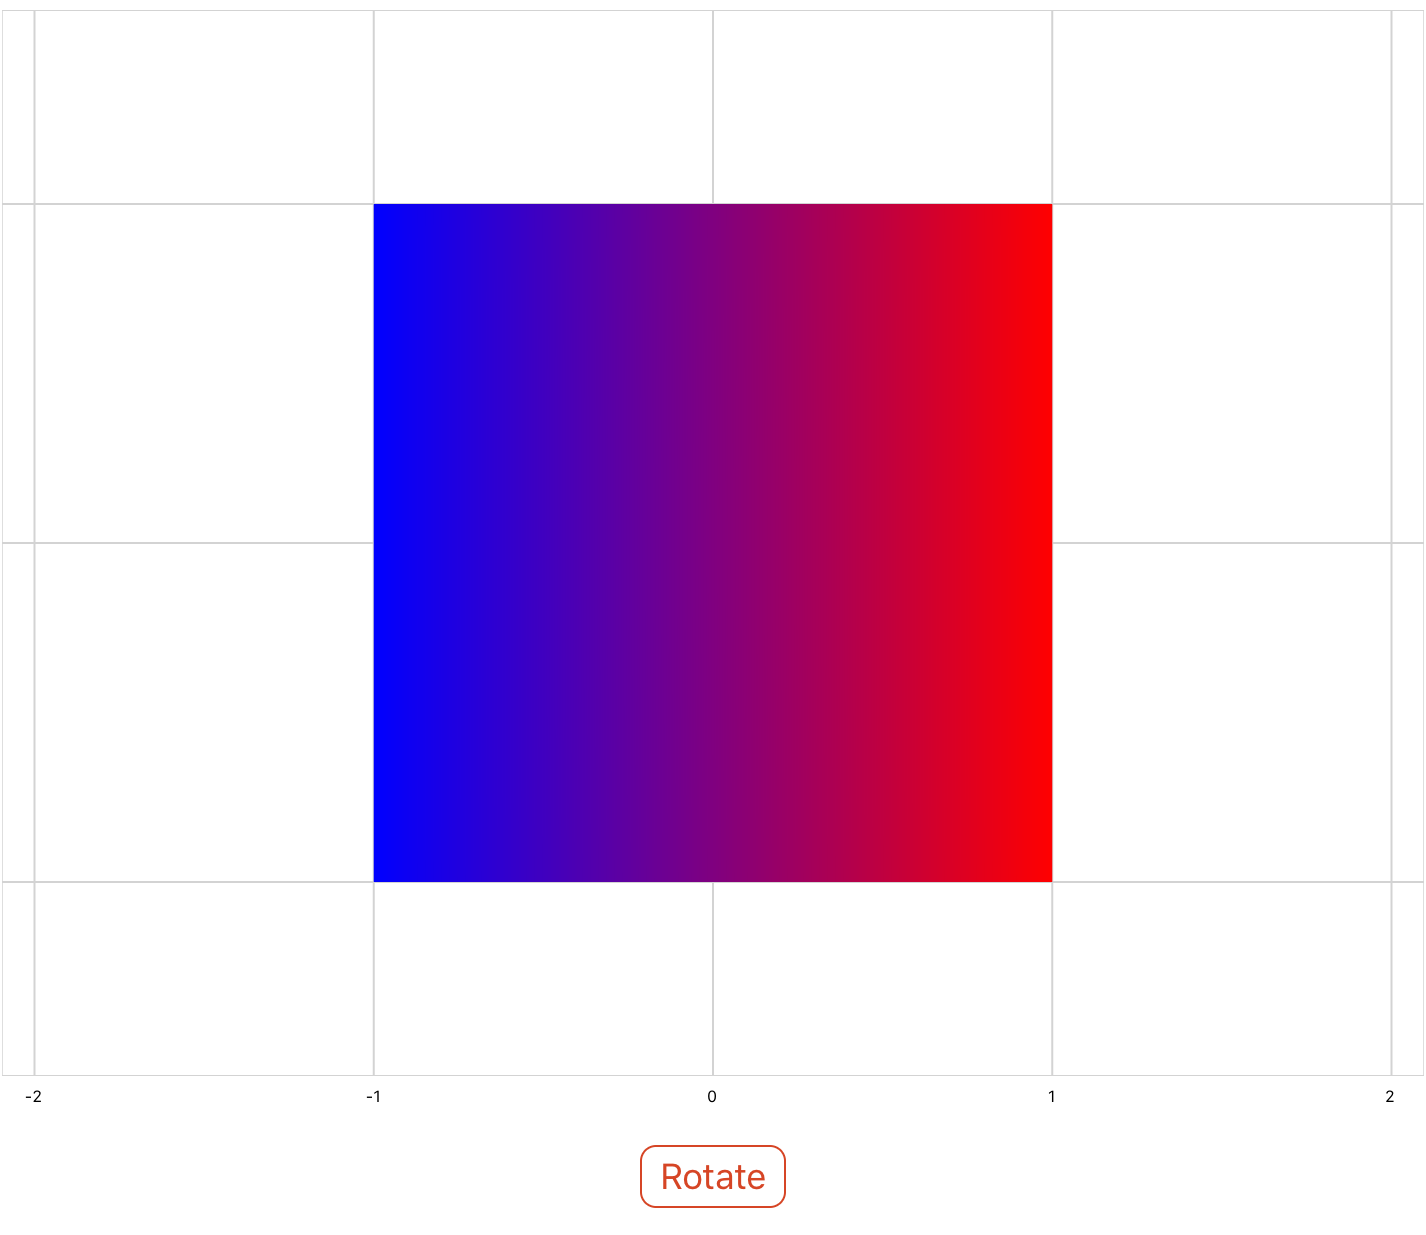
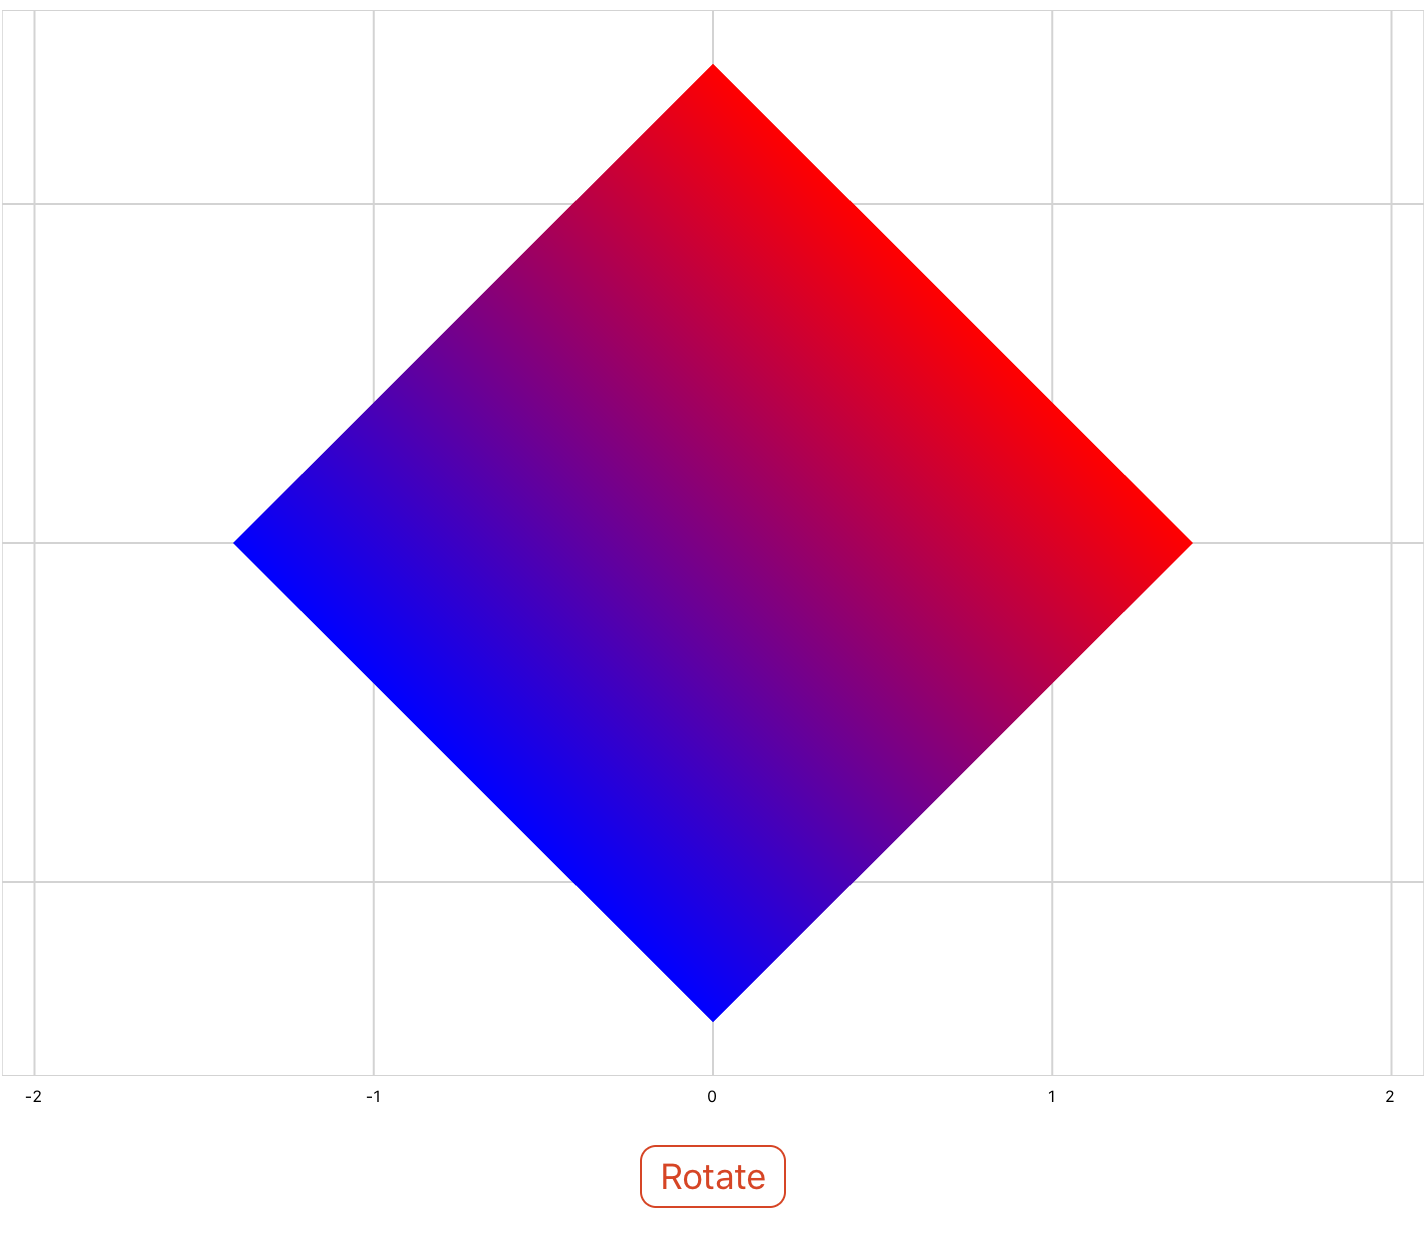
Use the rotationAboutAxis property to rotate shapes counterclockwise about a specified axis. The rotation angle should be specified in radians. Take a look at the below example, which uses a button to rotate a square in 45 degree (~0.785 rad) increments.
Note that the axis of rotation is at the origin. If you would like to rotate about a different point, the data must first be translated before being rotated. See Combining Transformations at the bottom of the page.
<xyPlot name="myPlot">
  <series name="series1" draw="radialFill">
    <data>0 0; 1 1; 1 -1; -1 -1; -1 1; 1 1</data>
    <colors>purple; red; blue; blue; red; red</colors>
  </series>
</xyPlot>

<script>
  angle = 0
</script>

<button content="Rotate">
  <onClick>
    myPlot.series1.Transform = matrixf.rotationAboutAxis(0, 0, 1, angle);
    angle = angle + 0.785;
  </onClick>
</button>

Translation
The translation property can be used to translate a shape along the x and y axes. In the below example, a square is shifted up and to the left using a simulation.
<xyPlot name="myPlot">
  <series name="series3" draw="radialFill">
    <data>-5 0; -6 1; -6 -1; -4 -1; -4 1; -6 1</data>
  </series>
</xyPlot>

<script>
  x = 0
  y = 0
  z = 0
</script>

<simulation name="mySim">
  <onActivePageChanged>
    if active then
      mySim:Start()
    else
      mySim:Stop()
    end
  </onActivePageChanged>
  <onUpdate>
    myPlot.series3.Transform = matrixf.translation(x,y,z);
    x = x - 1
    y = y + 0.5
  </onUpdate>
</simulation>
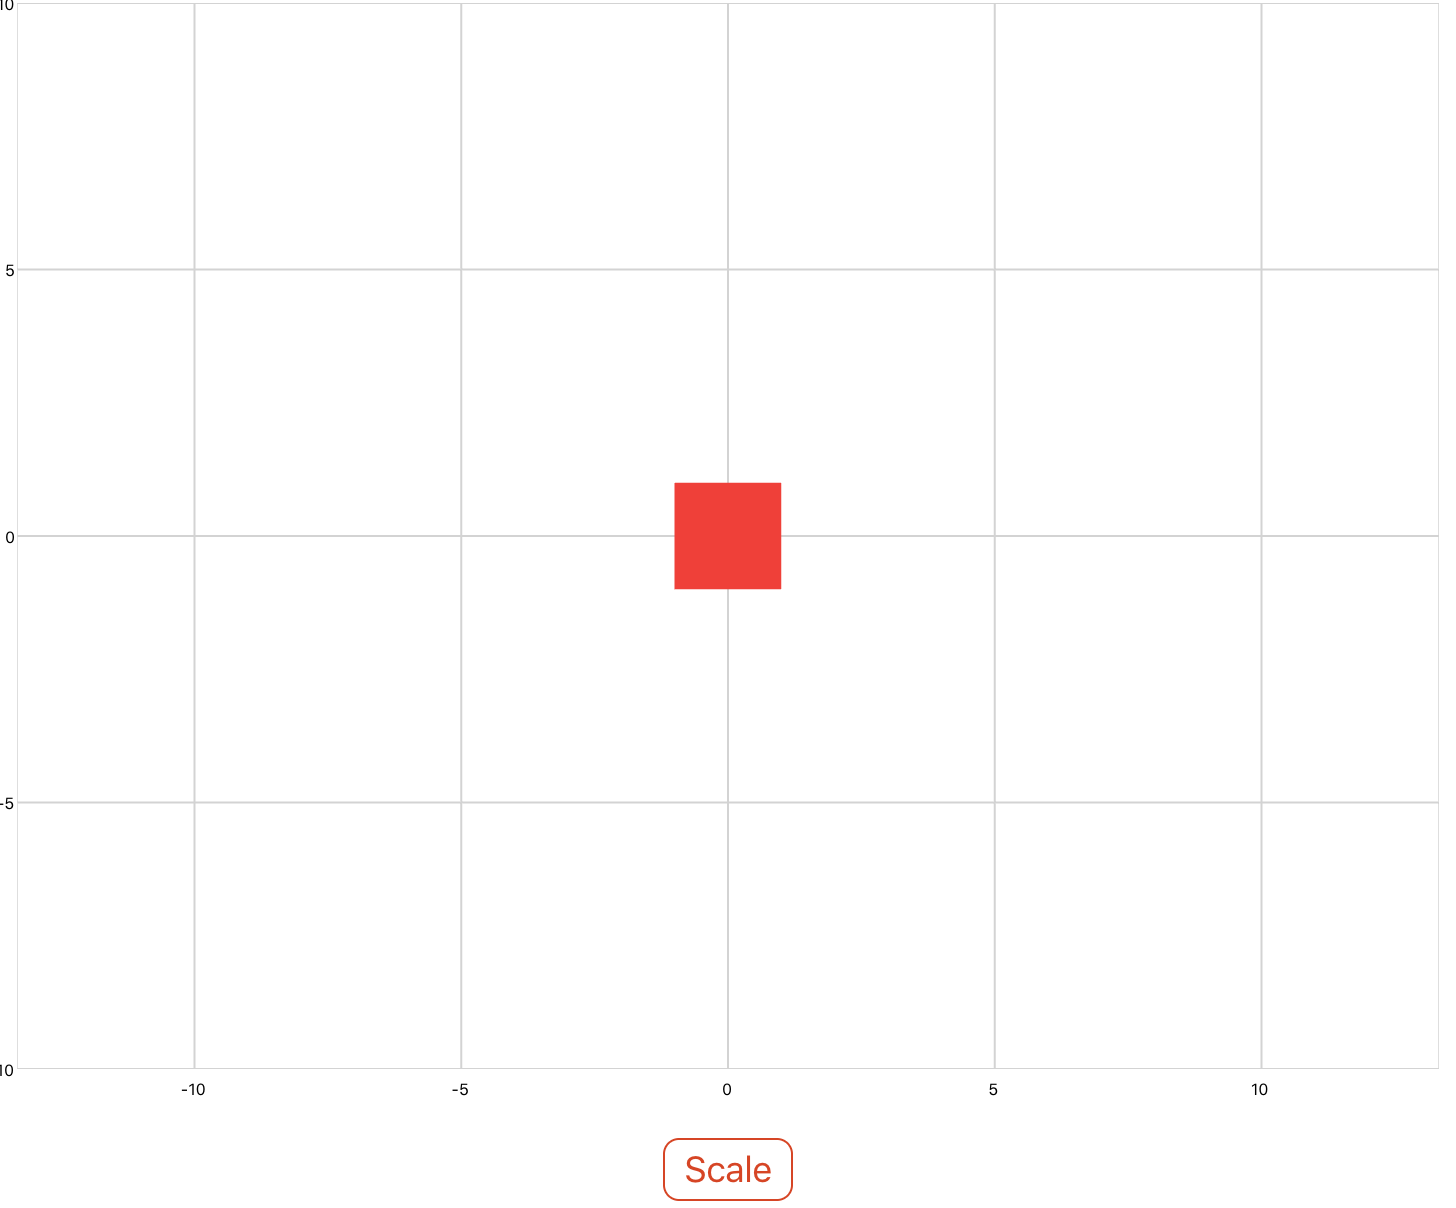
Scaling
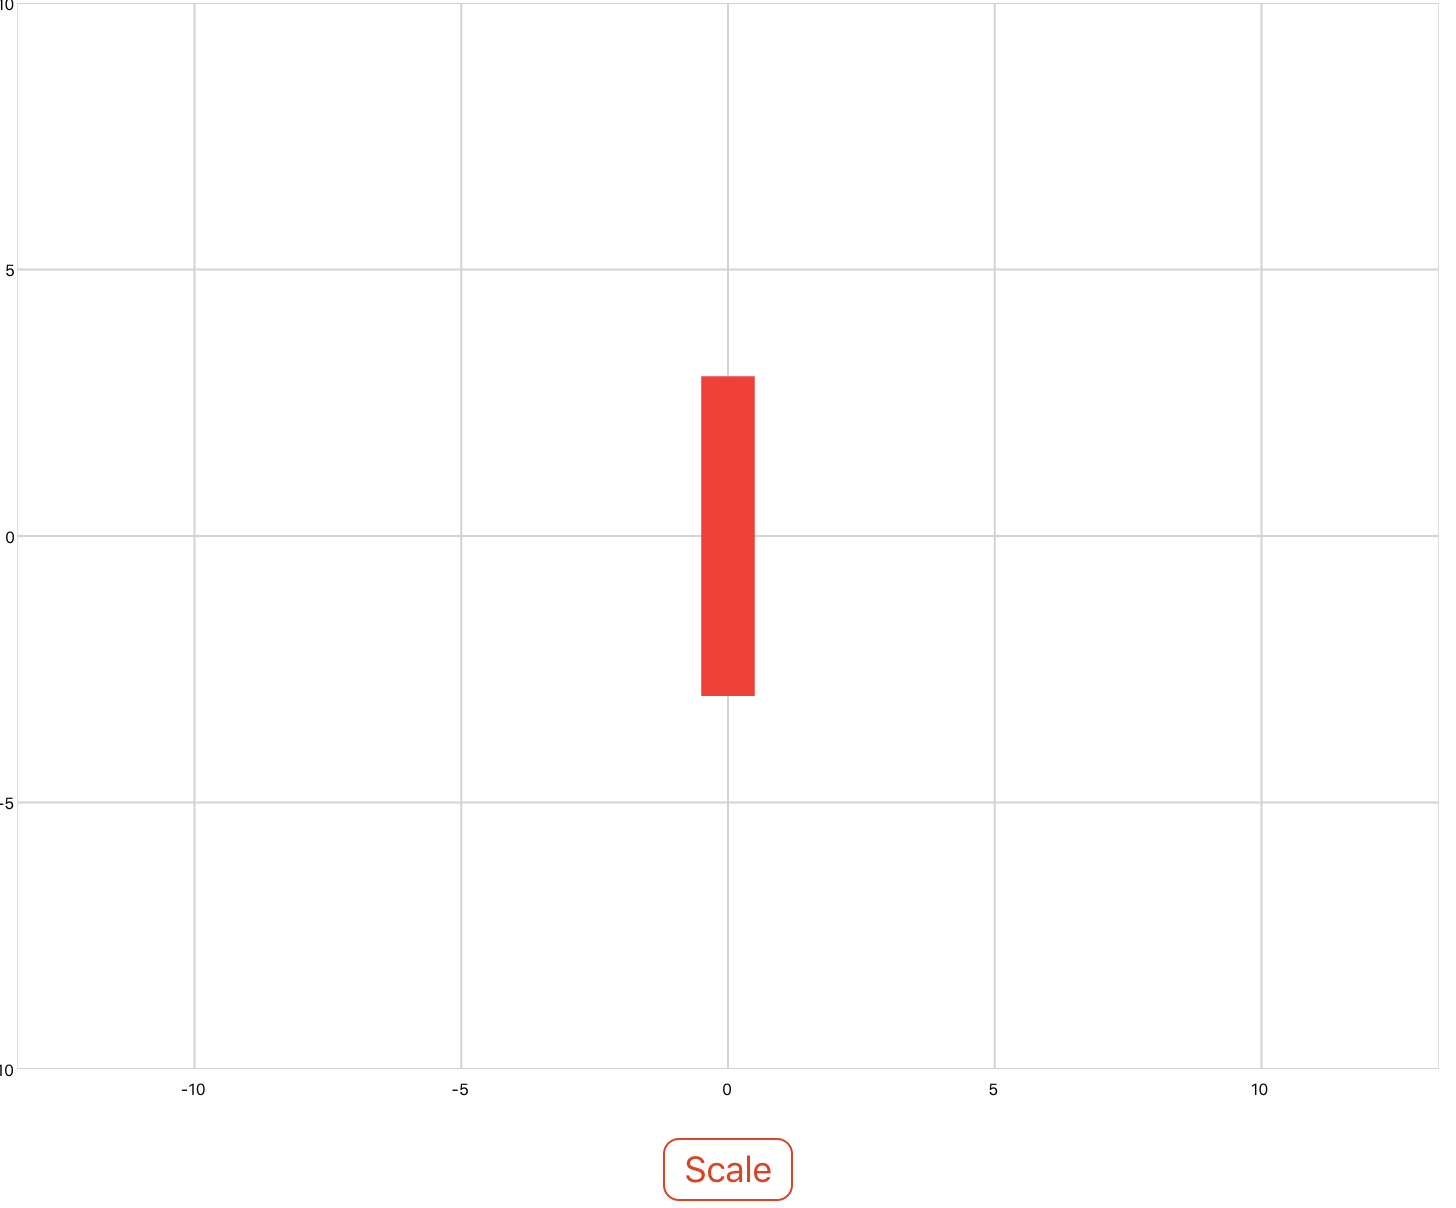
Use the scaling property to scale objects in the x and y directions. The scale is specified as a factor and can be specified as a uniform scale factor, as scale factors for each x, y, and z, or as a vector of scale factors.
The below example scales a square by different x and y factors. Note that the square is scaled about the origin. If you would like to scale about a different point, the data must first be translated before being scaled. See Combining Transformations at the bottom of the page.
<xyPlot name="myPlot">
  <series name="series" draw="radialFill">
    <data>0 0; 1 1; 1 -1; -1 -1; -1 1; 1 1</data>
  </series>
</xyPlot>

<button content="Scale">
  <onClick>
    -- matrixf.scaling(factor x, factor y, factor z)
    myPlot.series.Transform = matrixf.scaling(0.5, 3, 1);
  </onClick>
</button>

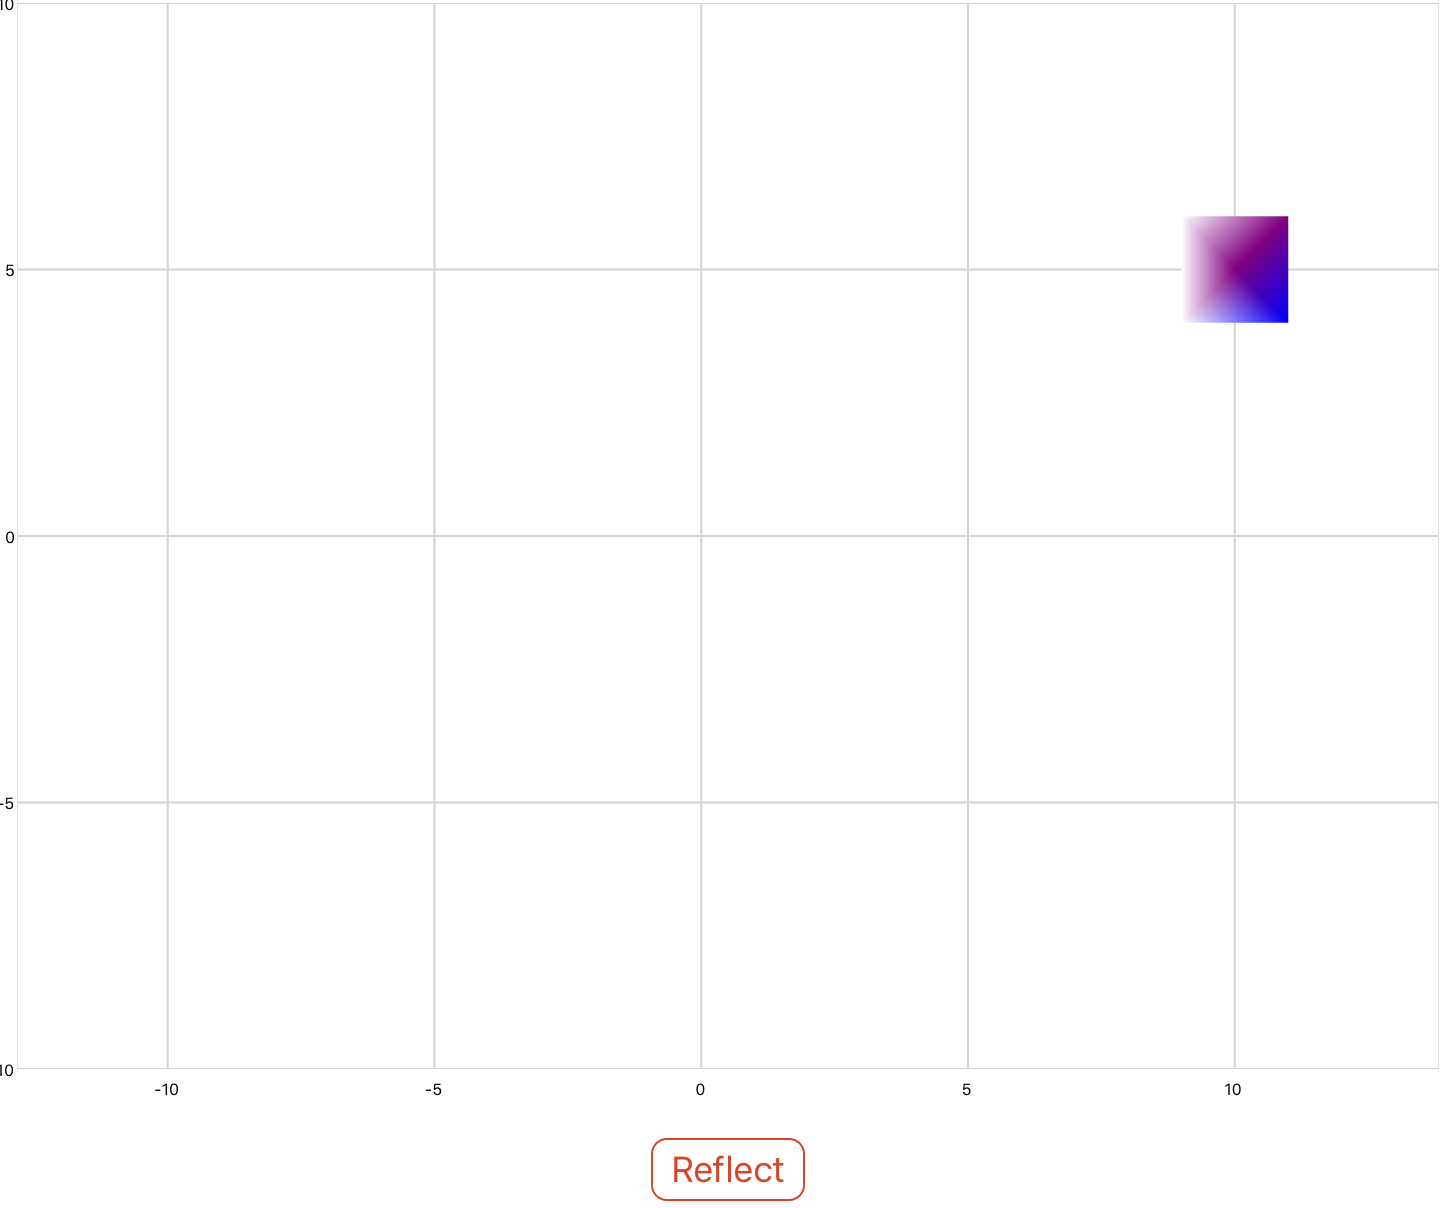
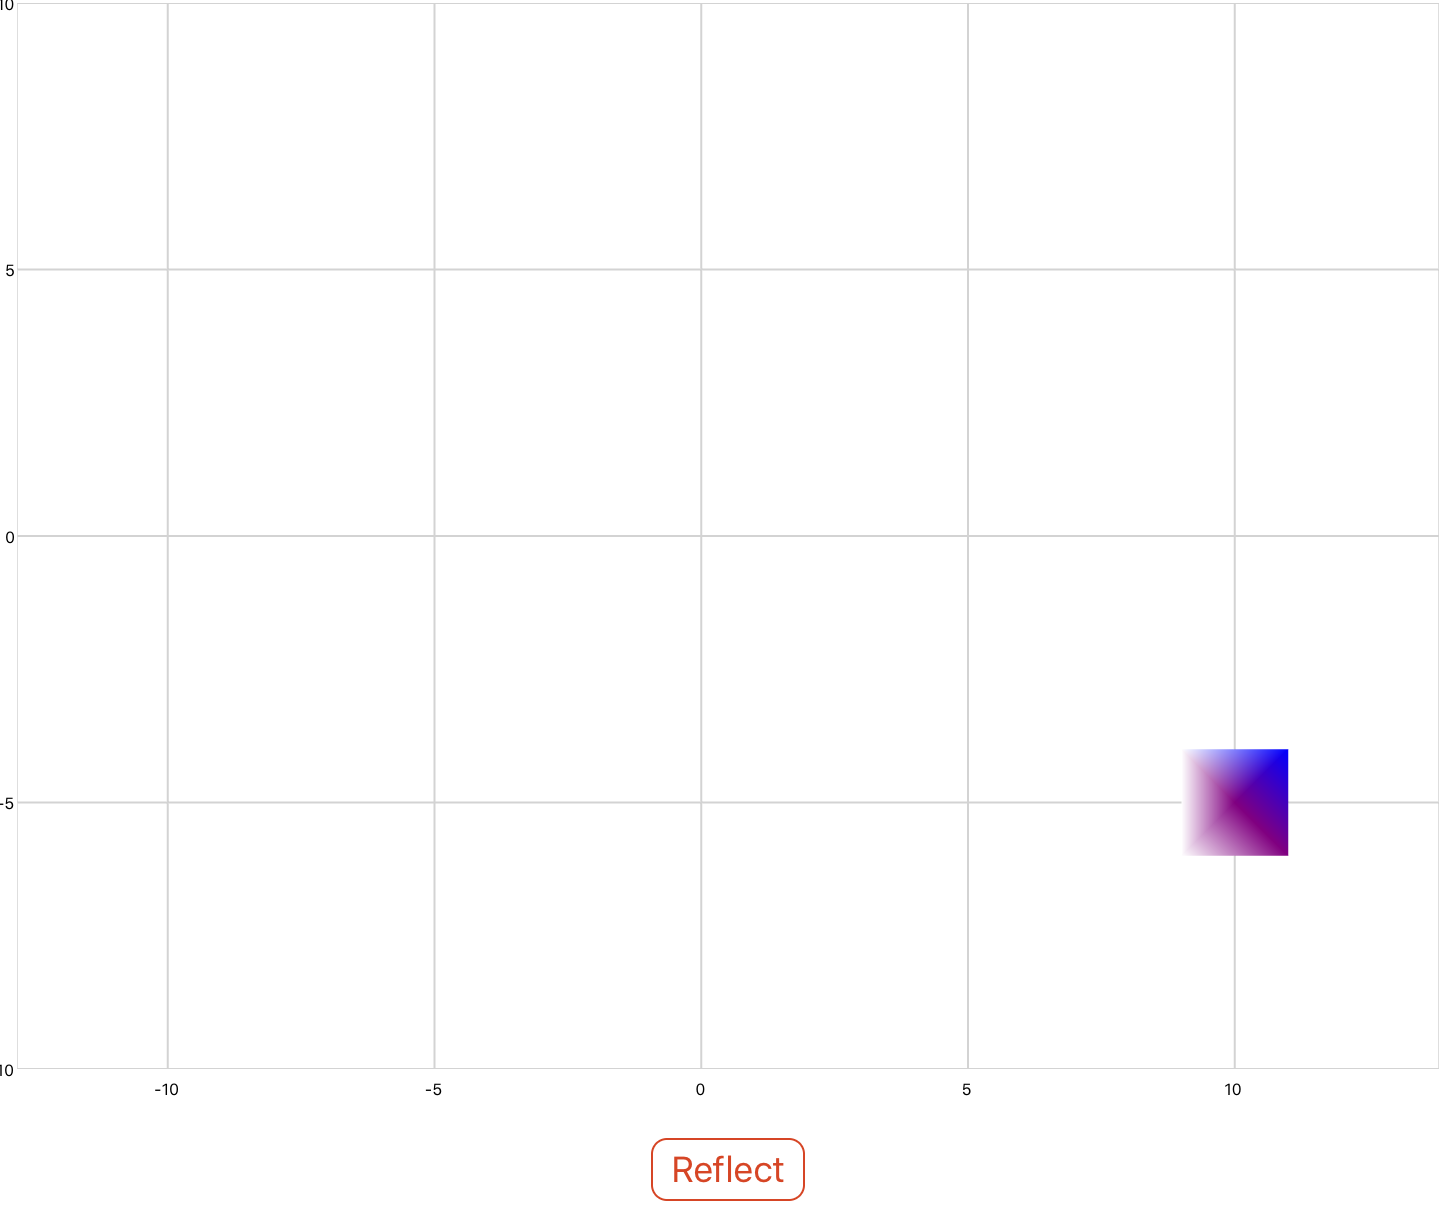
Reflection
The reflection property allows you to reflect shapes about the x and y axes by specifying the coefficients of the plane ax + by + cz = 0. In the example below a square is reflected about the y axis.
<xyPlot name="myPlot">
 <series name="series4" draw="radialFill">
    <data>0 5; 1 6; 1 4; -1 4; -1 6; 1 6</data>
    <colors>purple; purple; blue; white; white; purple</colors>
  </series>
</xyPlot>

<button content="Reflect">
  <onClick>
    myPlot.series4.Transform = matrixf.reflection(0,1,0);
  </onClick>
</button>
Combining Transformations
Combine transformations by multiplying their transformation matrices together. Matrices should be multiplied in the following order:
Translation * Rotation * Scale.
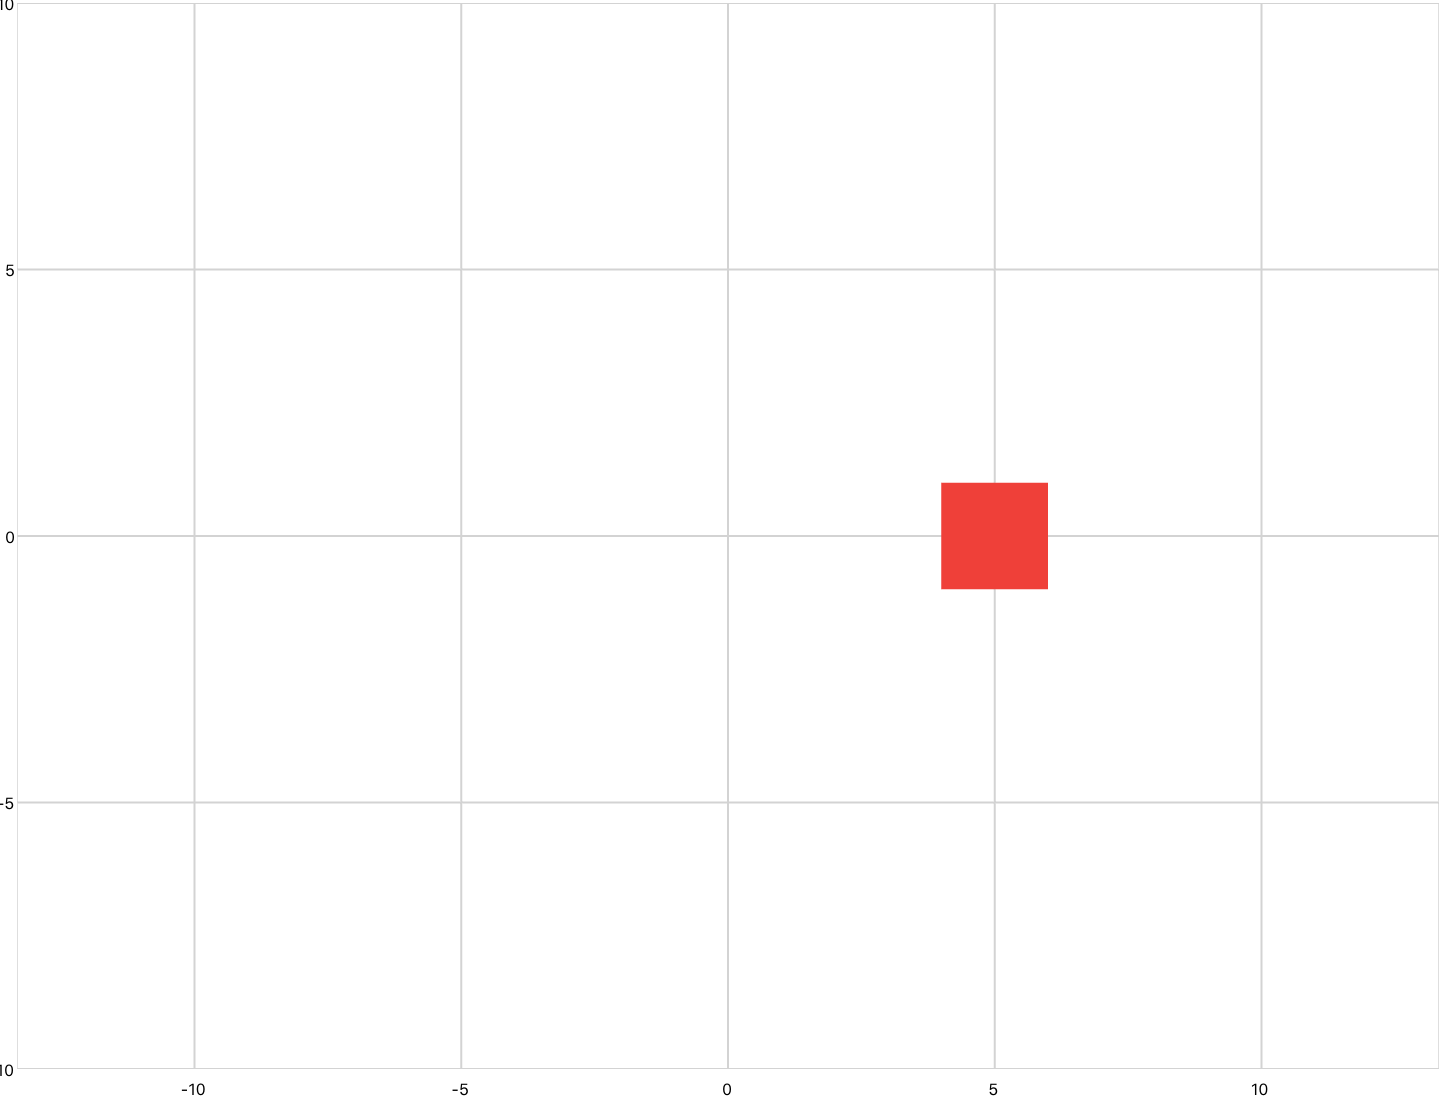
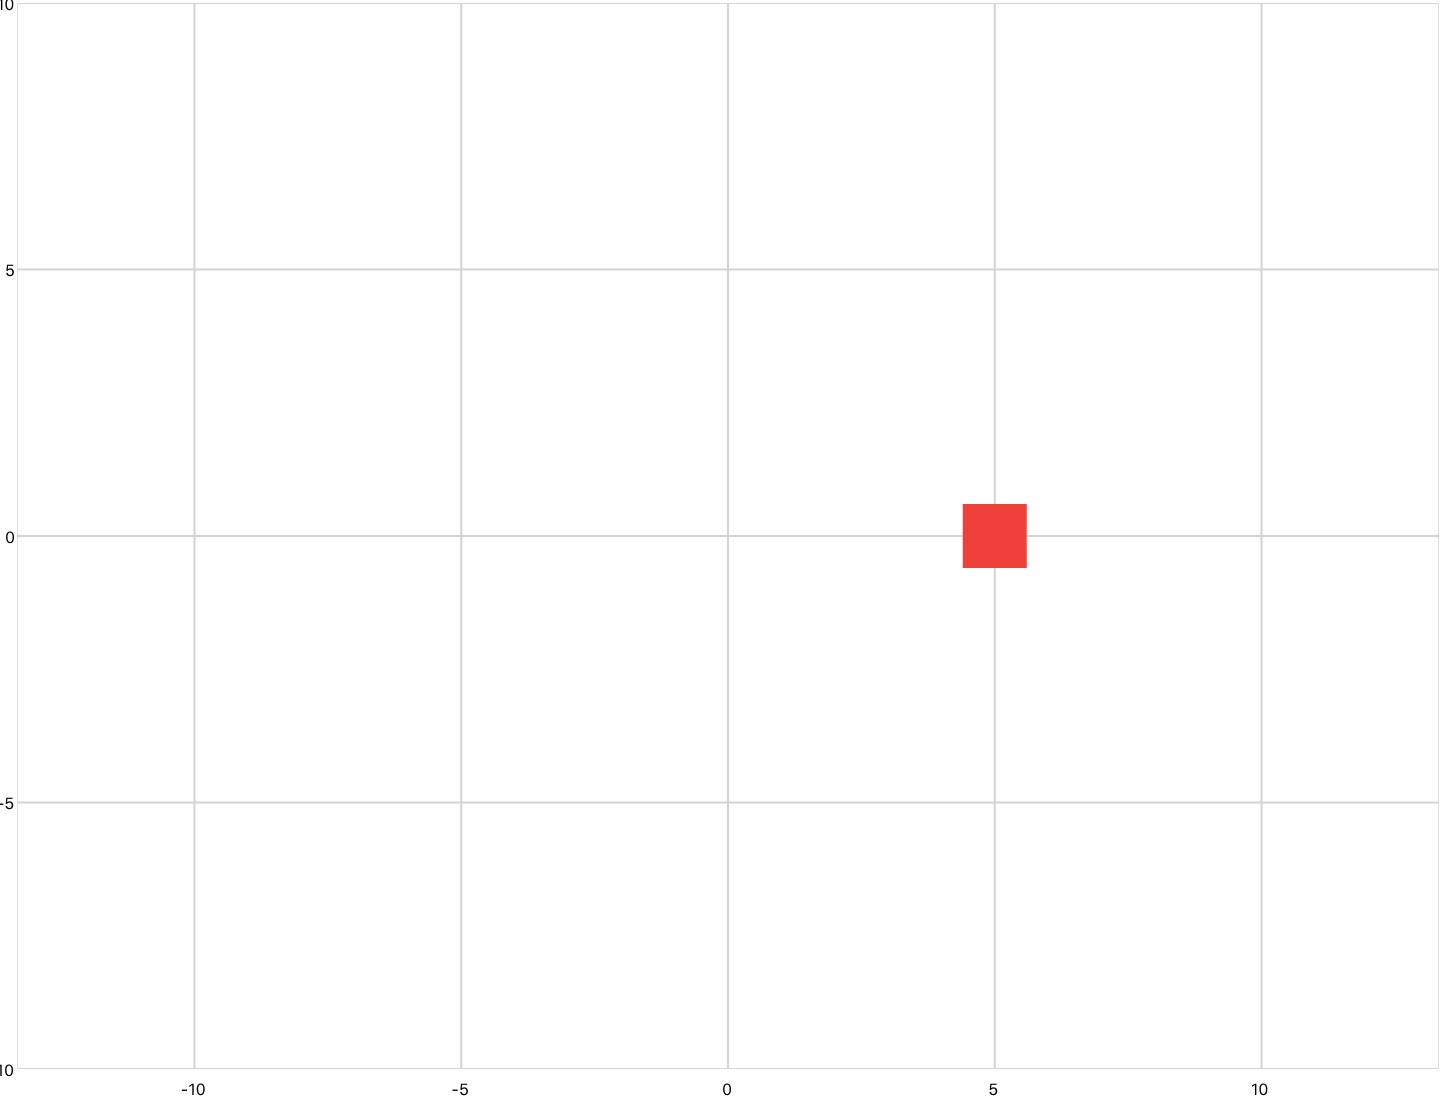
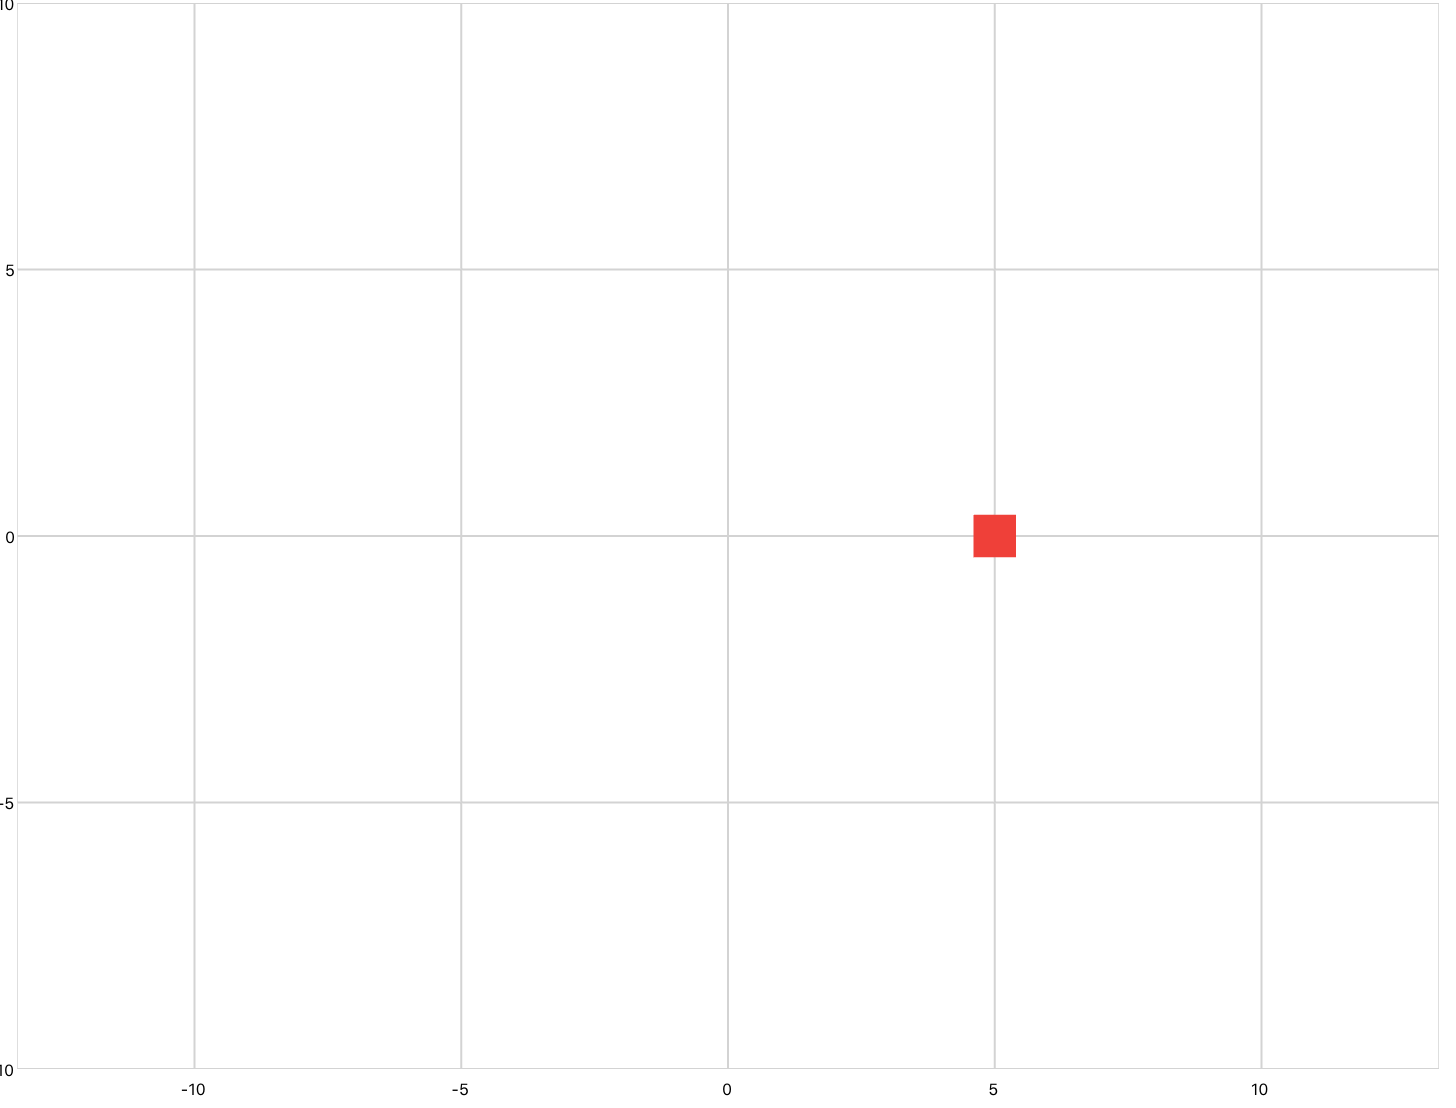
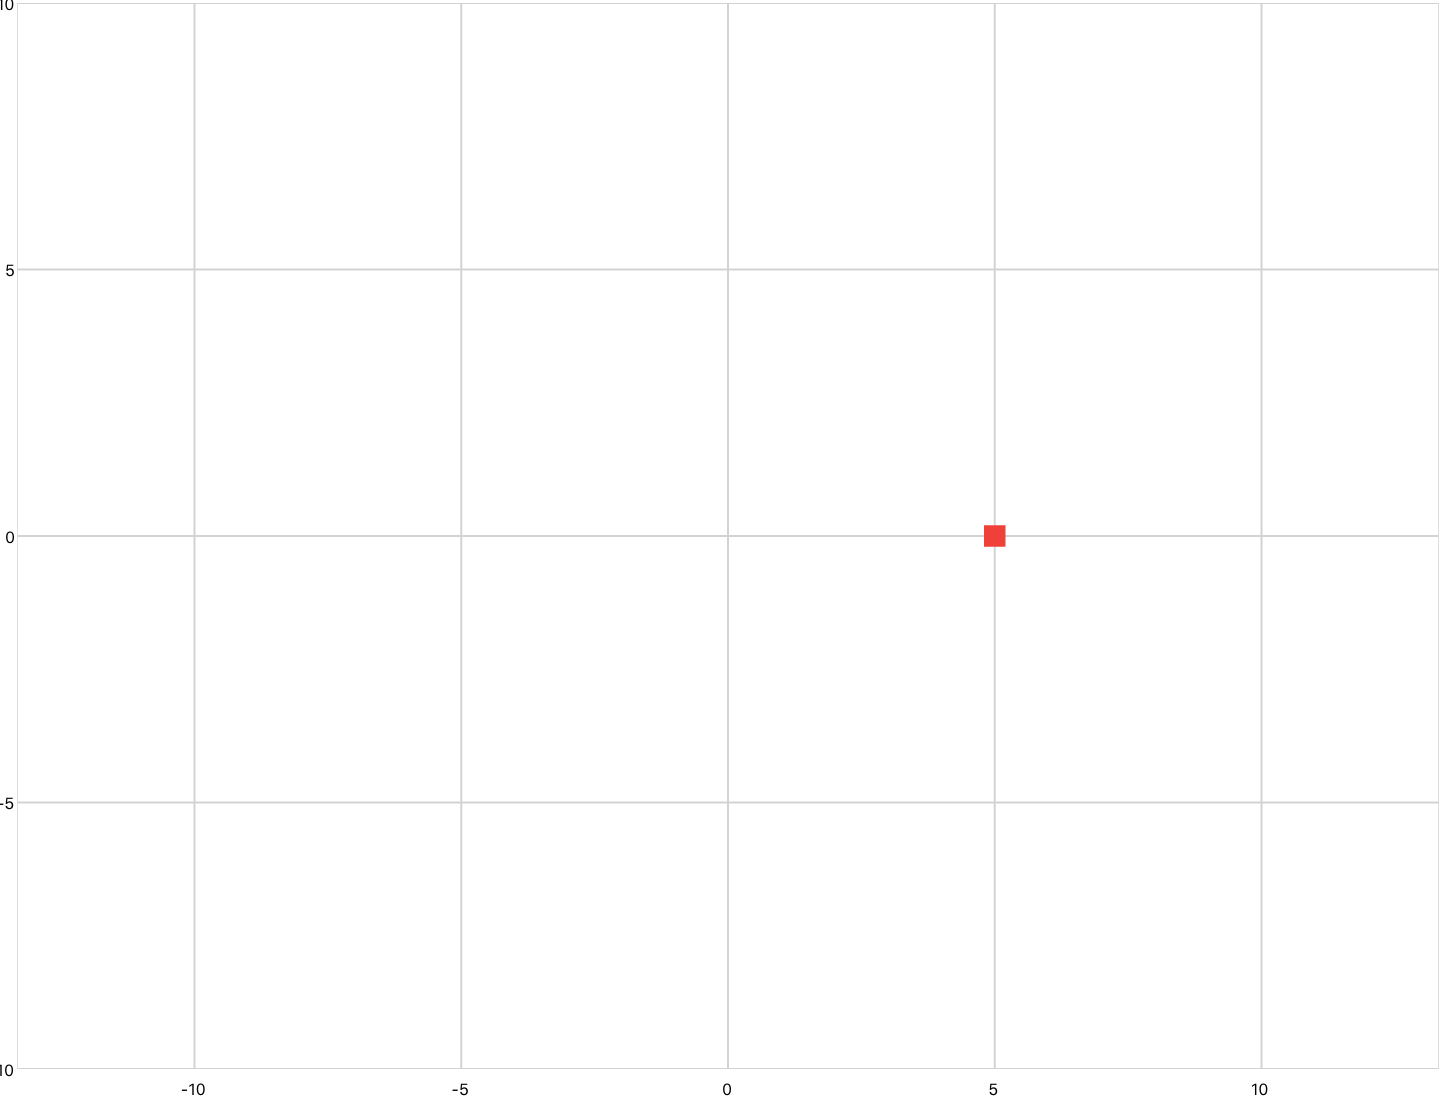
Example 1
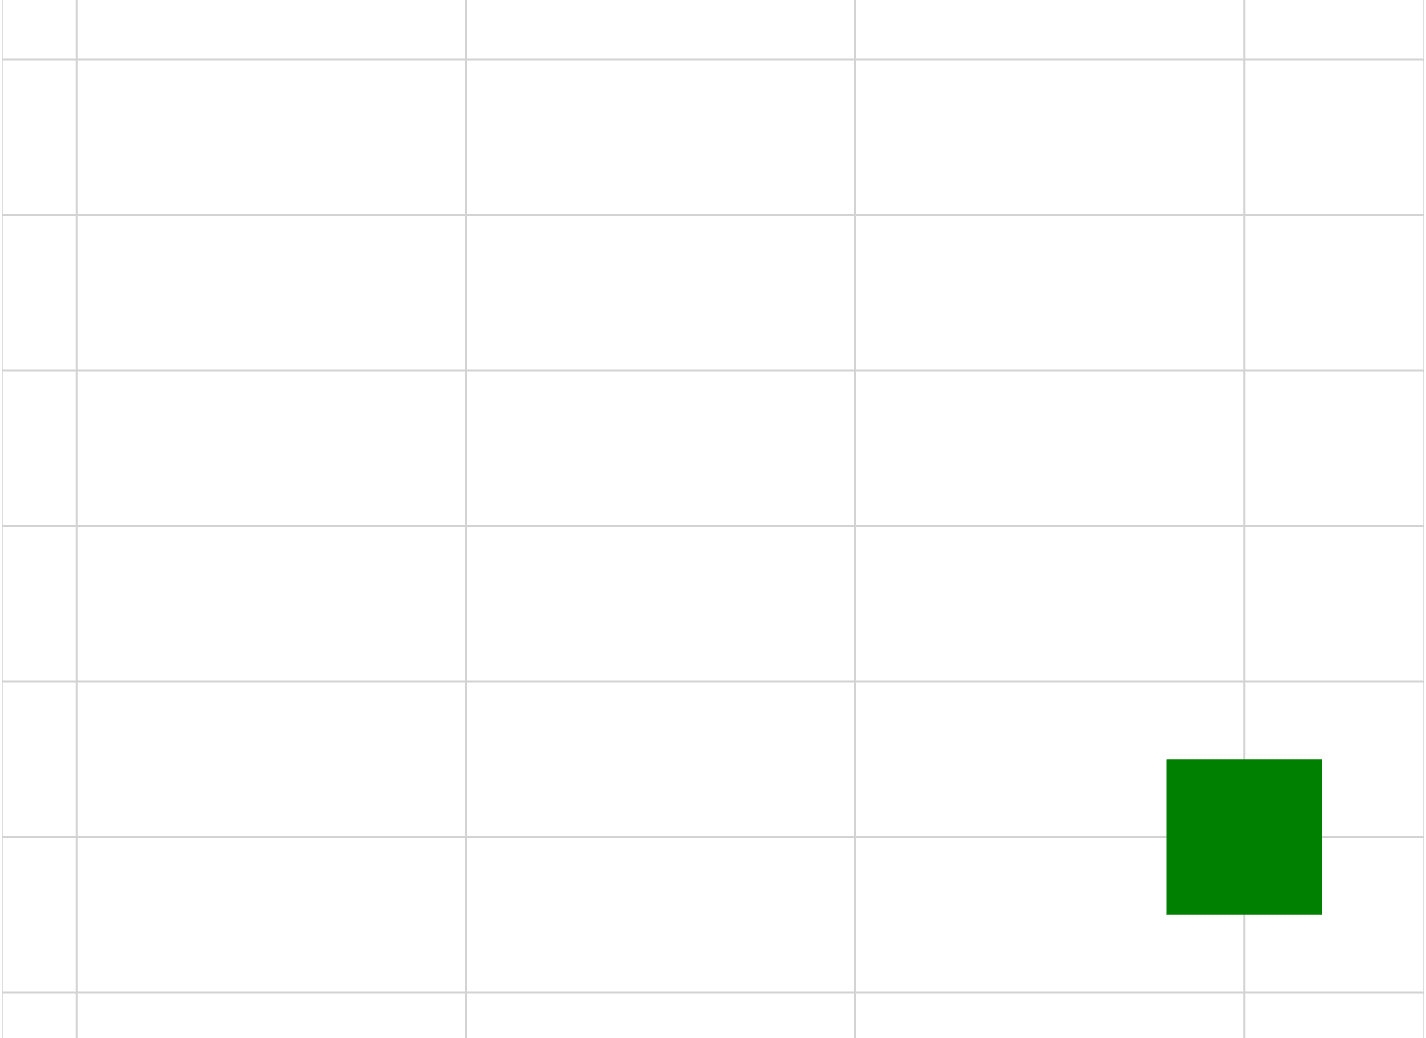
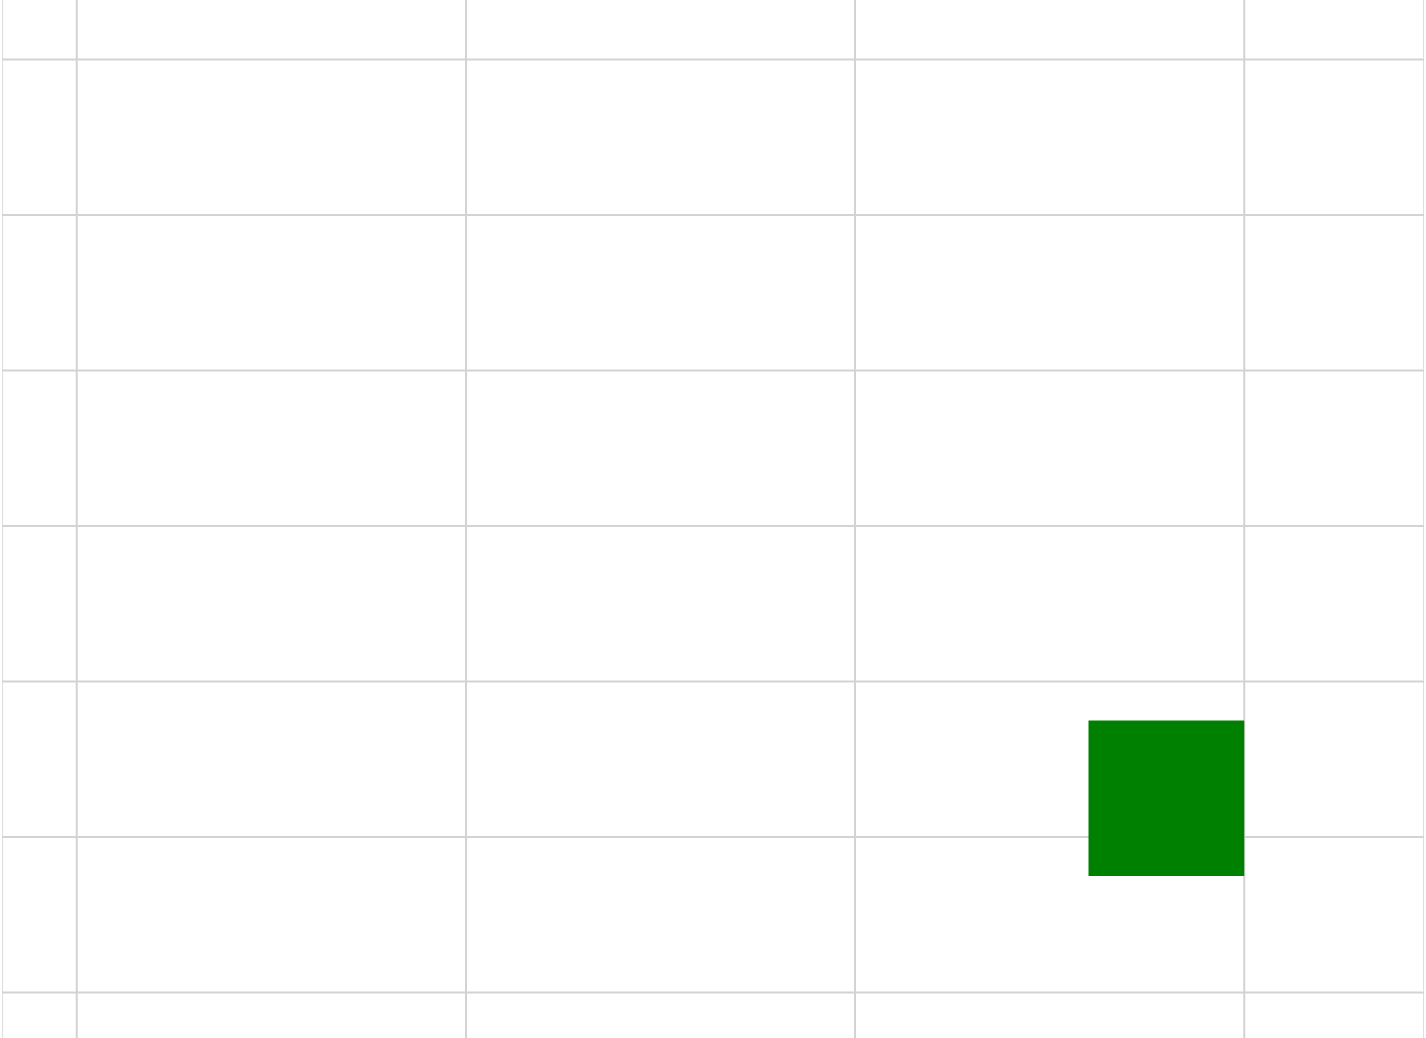
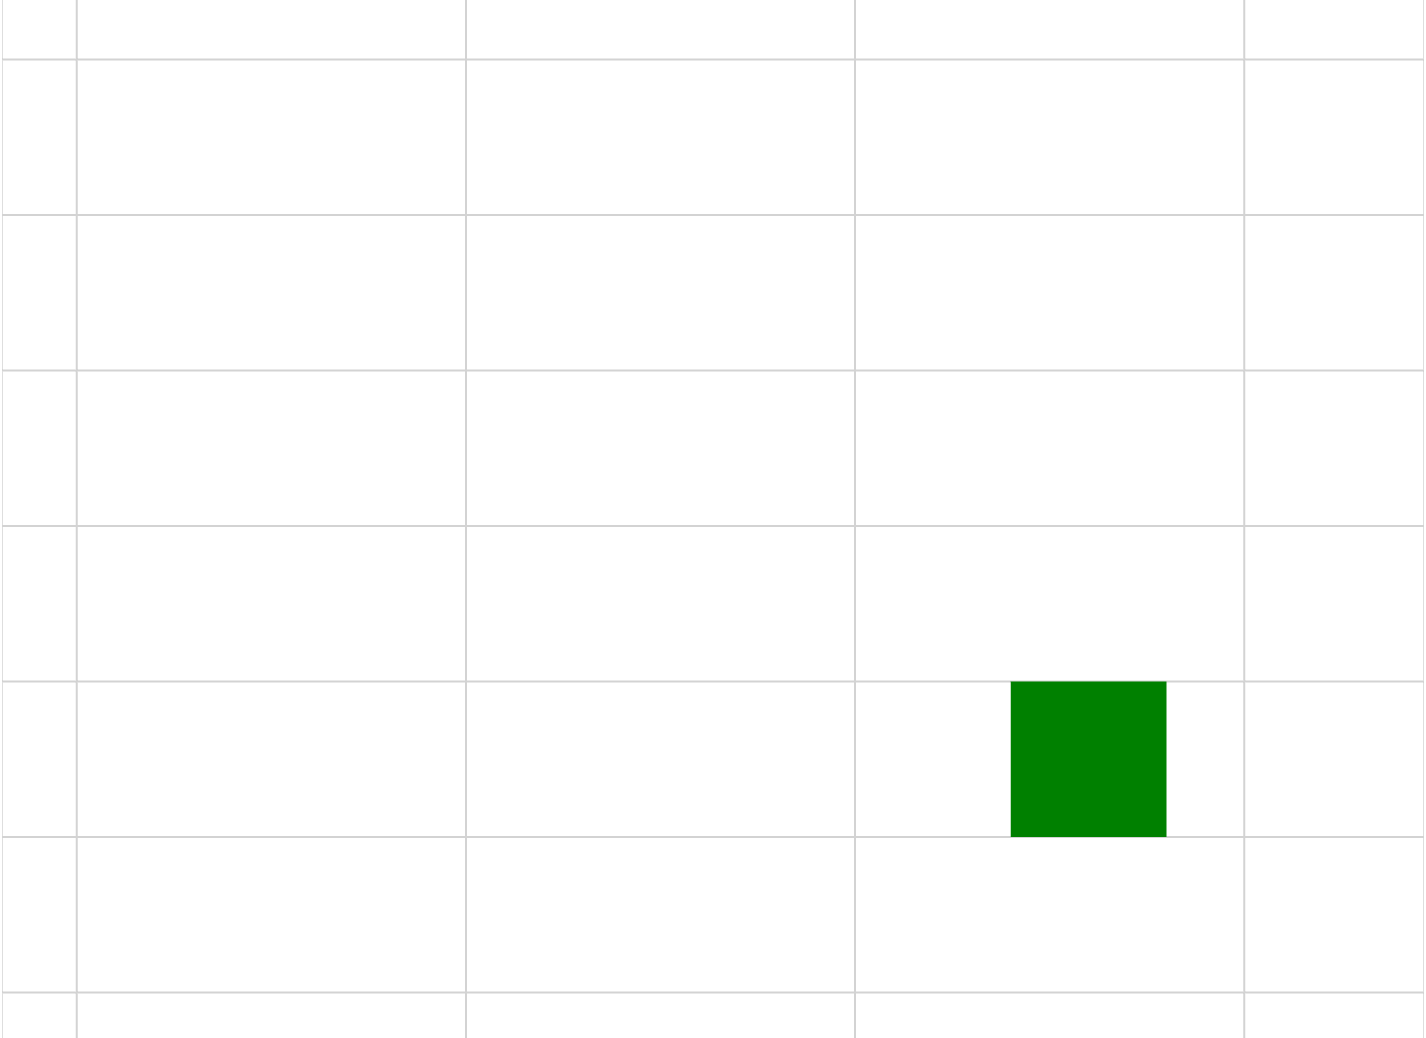
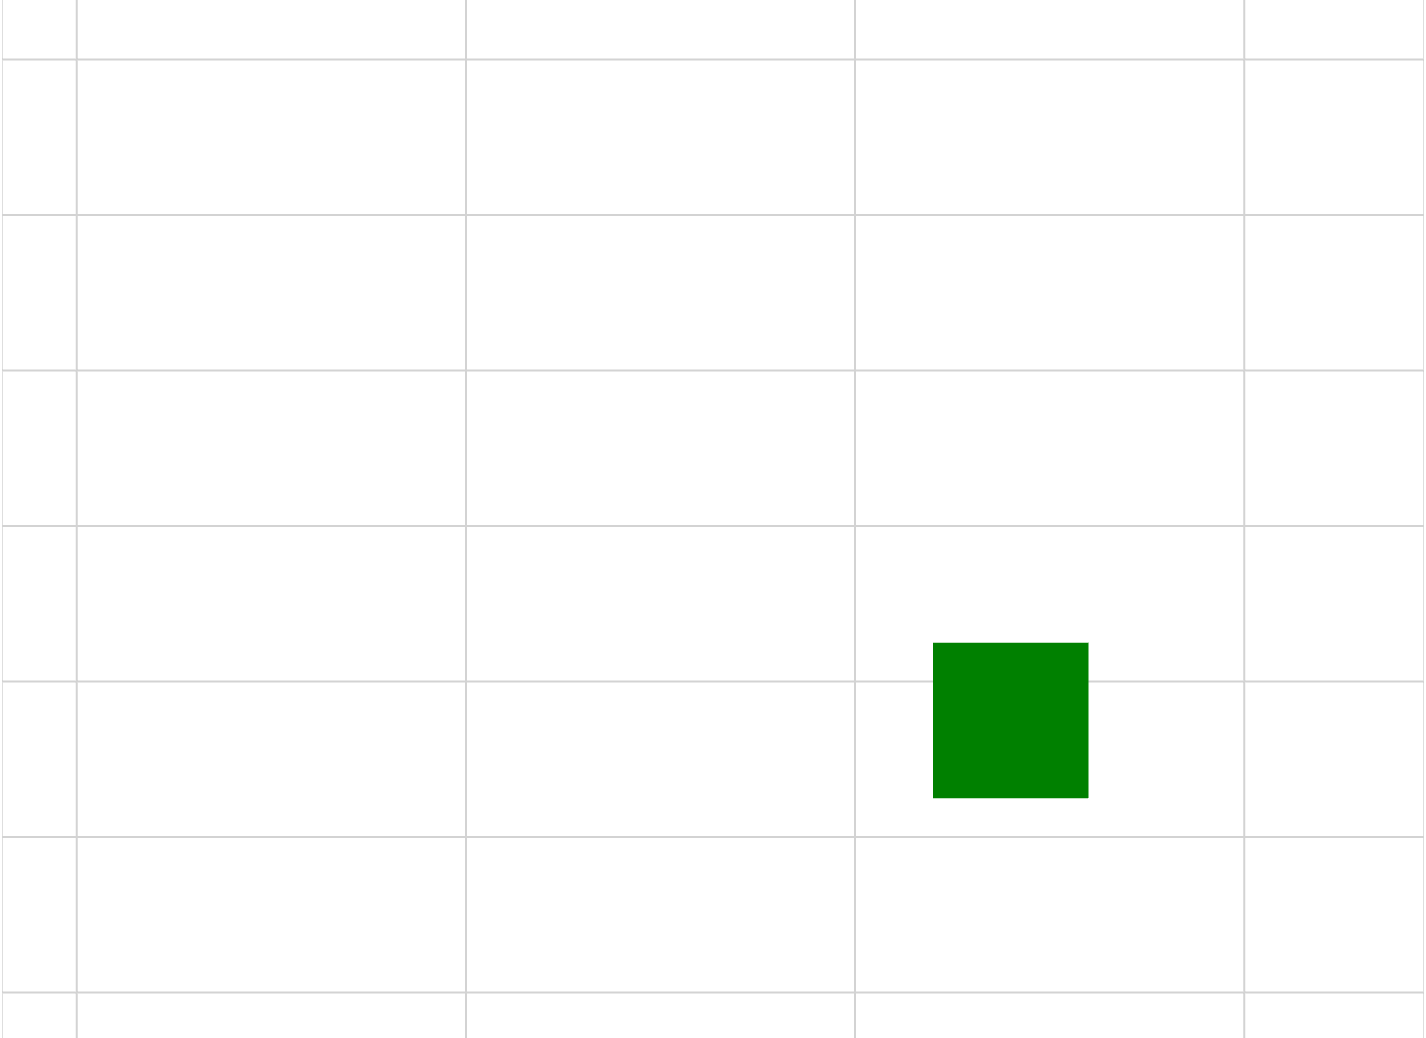
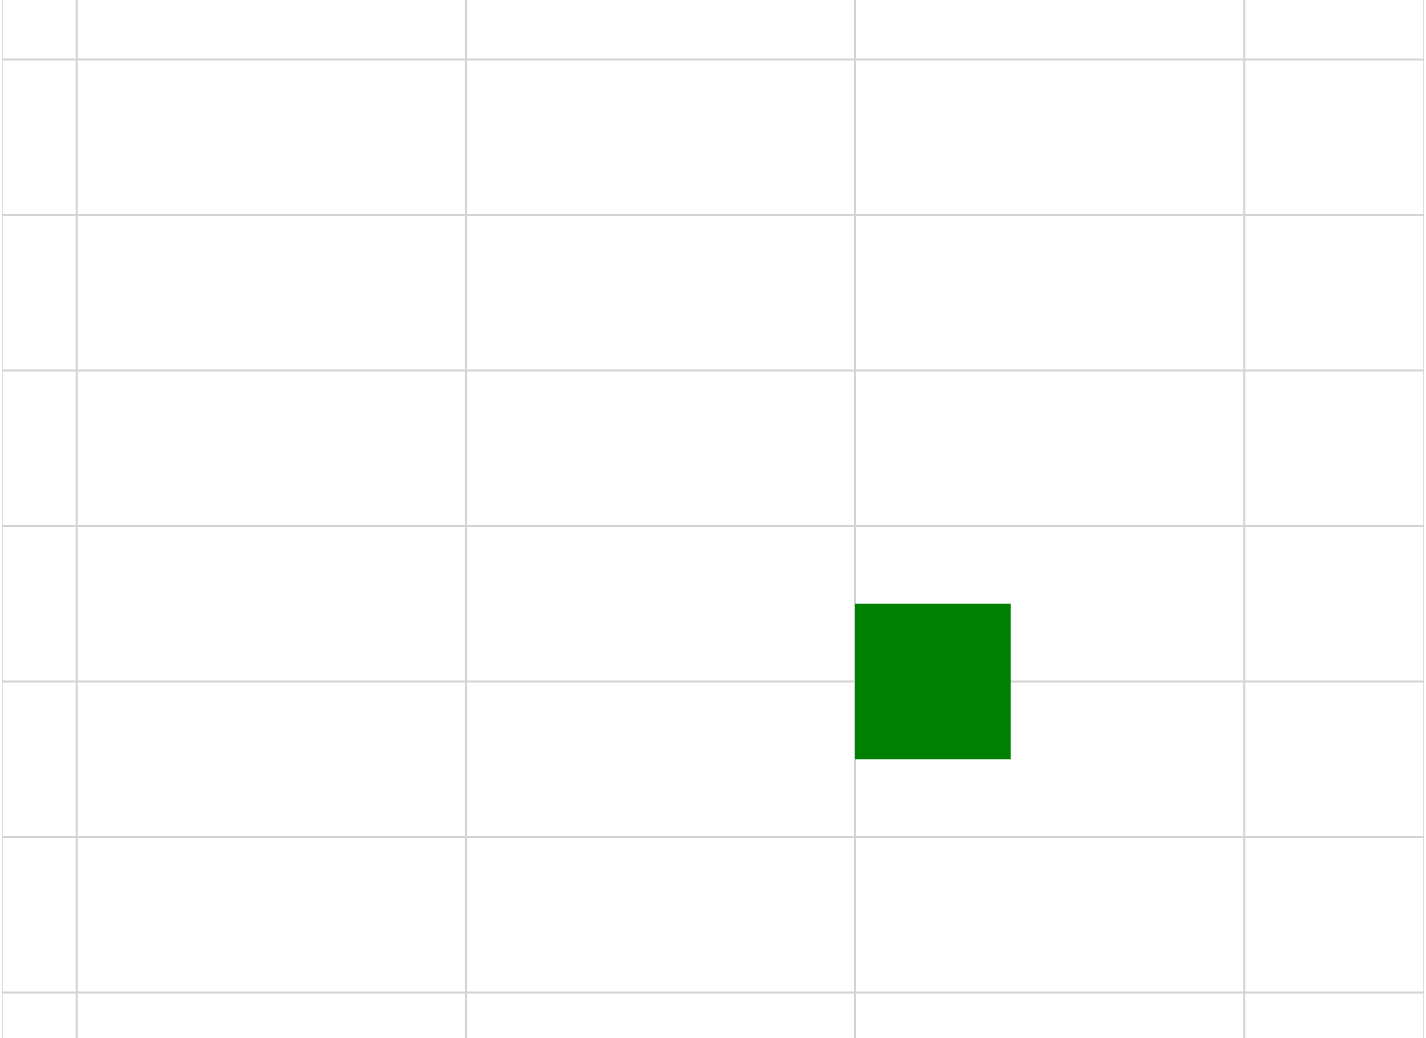
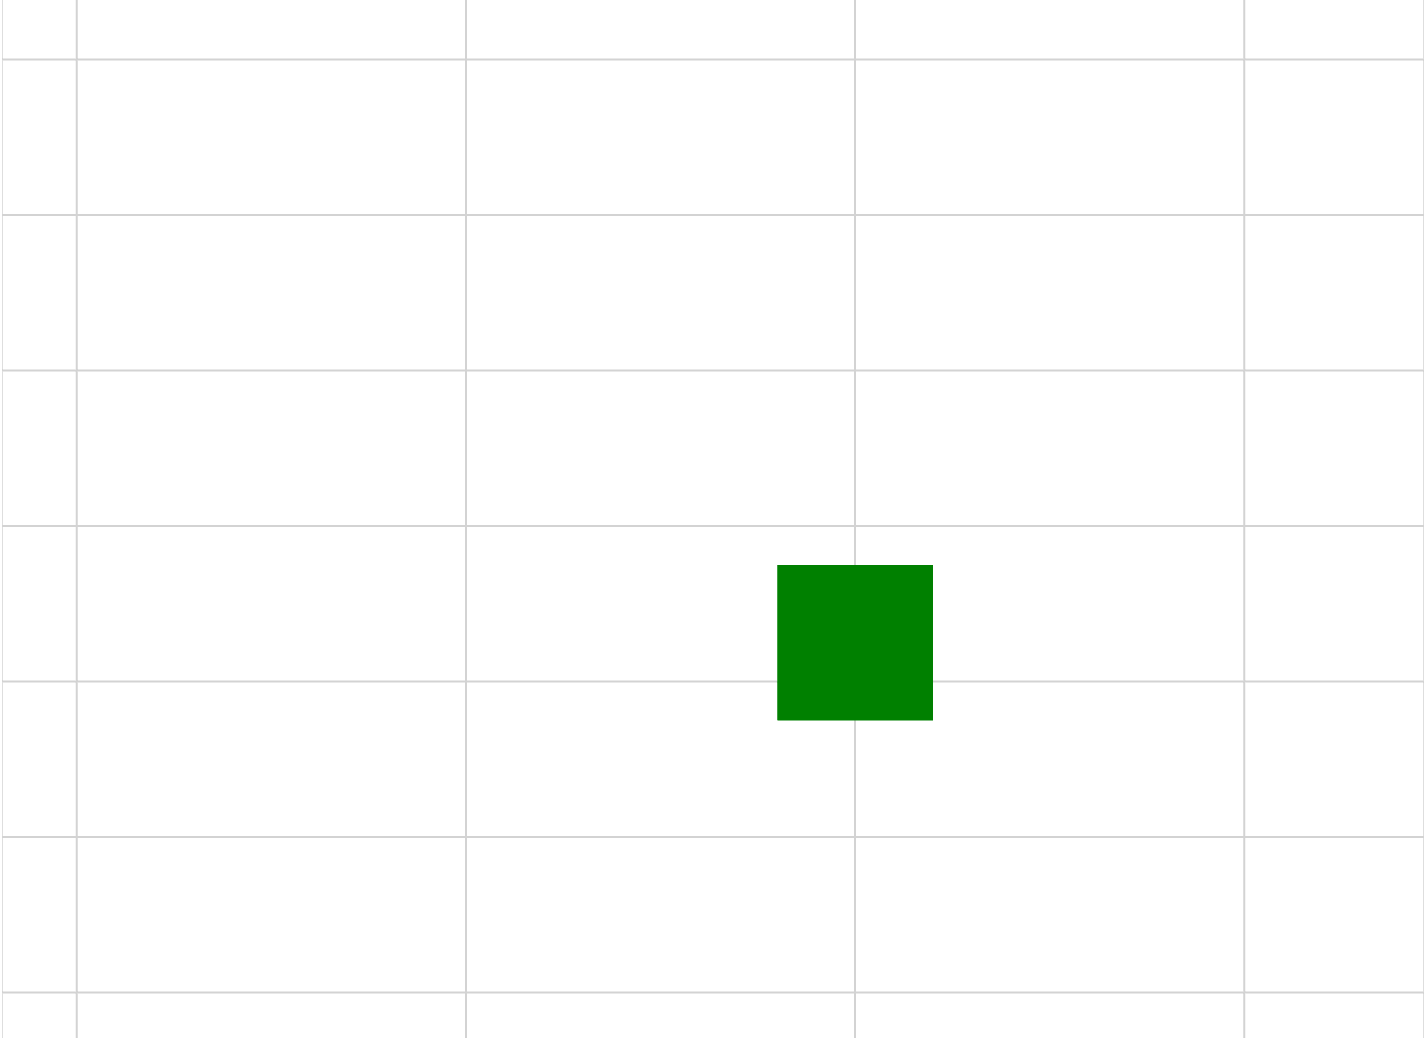
The below example uses a simulation to scale a square centered at (5,0). The square must first be translated to the origin, scaled, then translated back to (5,0). If the square was only scaled (without any translations) the square would shift closer to the origin with each decrease in scale size; the dual translations keep the square centered at (5,0).
Note the order that the transforms are applied (right to left).
<xyPlot name="myPlot">
  <series name="aSeries" draw="radialFill">
    <data>5 0; 6 1; 6 -1; 4 -1; 4 1; 6 1</data>
  </series>
</xyPlot>

<script>
  scale = 0.8
</script>

<simulation name="thisSim" period="1">
  <onActivePageChanged>
    if active then
    thisSim:Start()
    end
  </onActivePageChanged>
  <onUpdate>
    -- Transform order R to L: Translate in X by -5, Scale, Translate in X by +5
    myPlot.aSeries.Transform = matrixf.translation(5,0,0) * matrixf.scaling(scale % 1) * matrixf.translation(-5,0,0);
    scale = scale - 0.2
  </onUpdate>
</simulation>

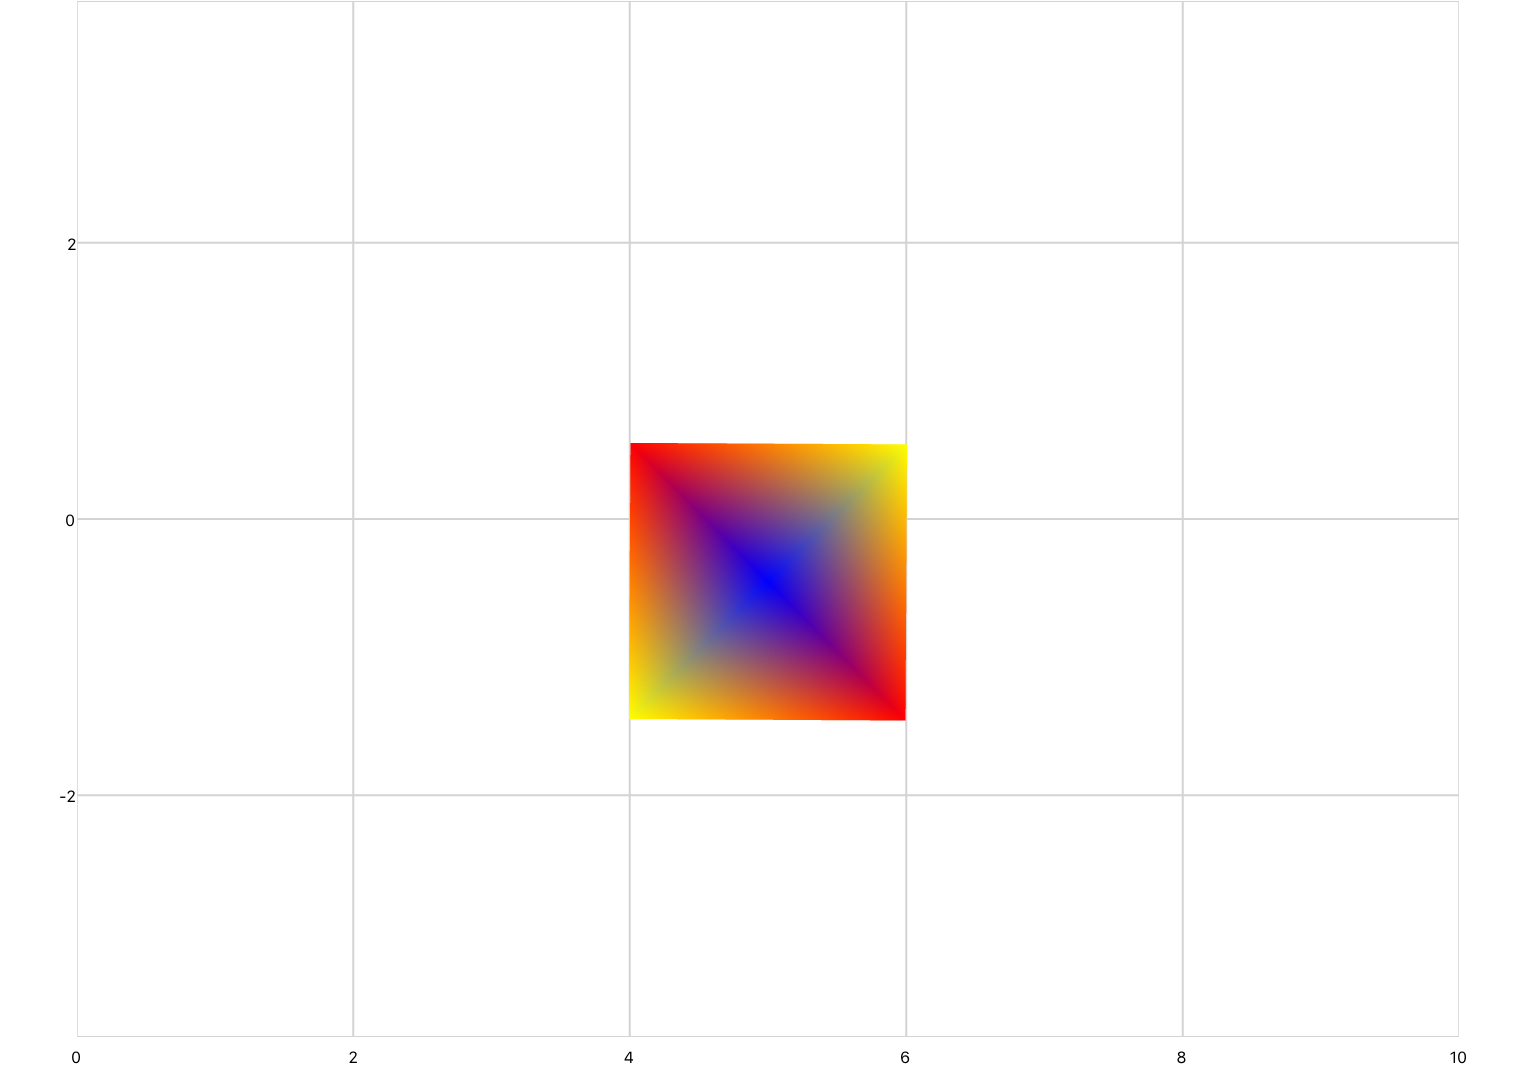
Example 2
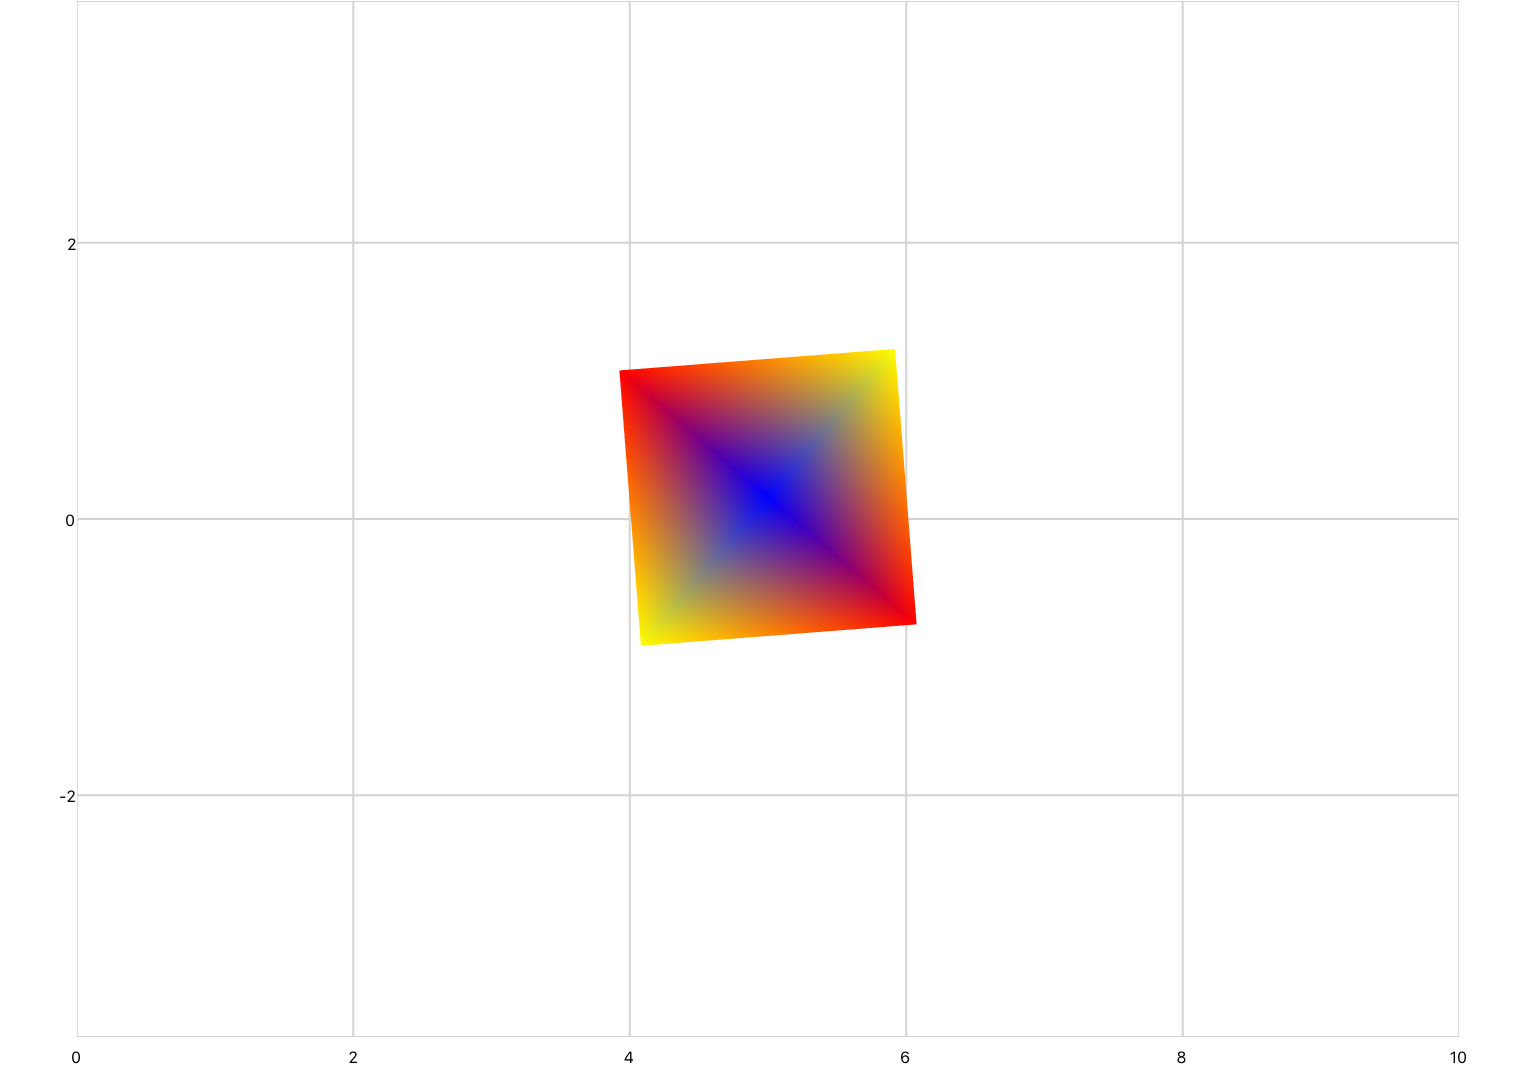
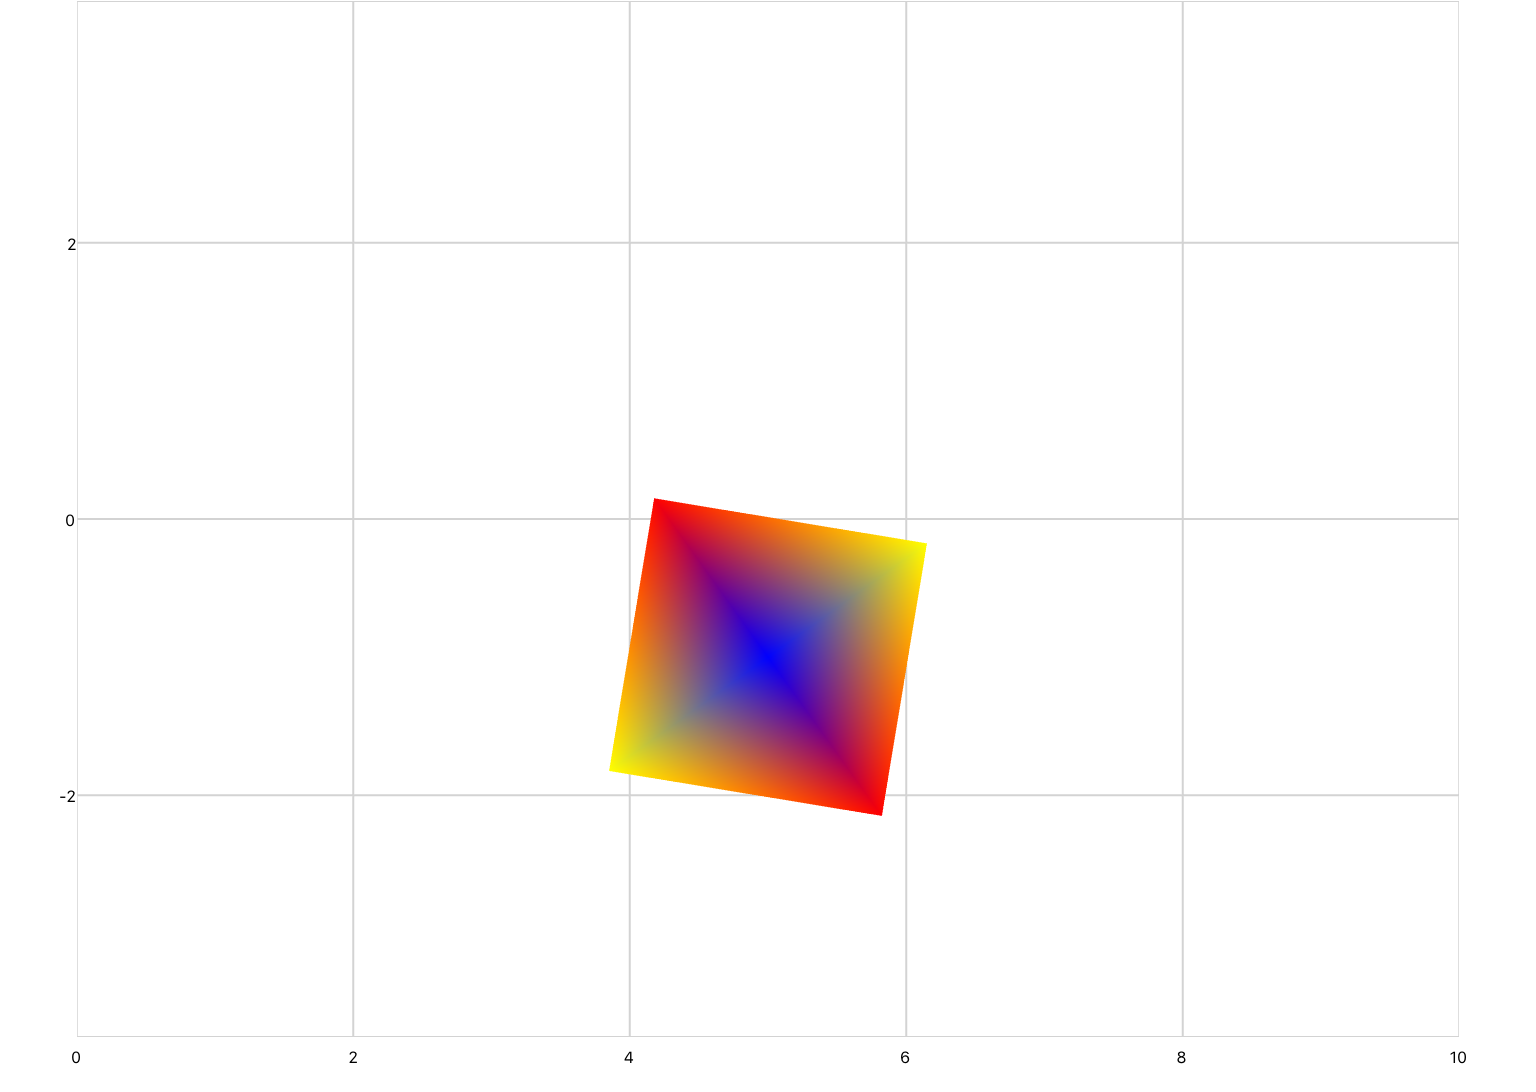
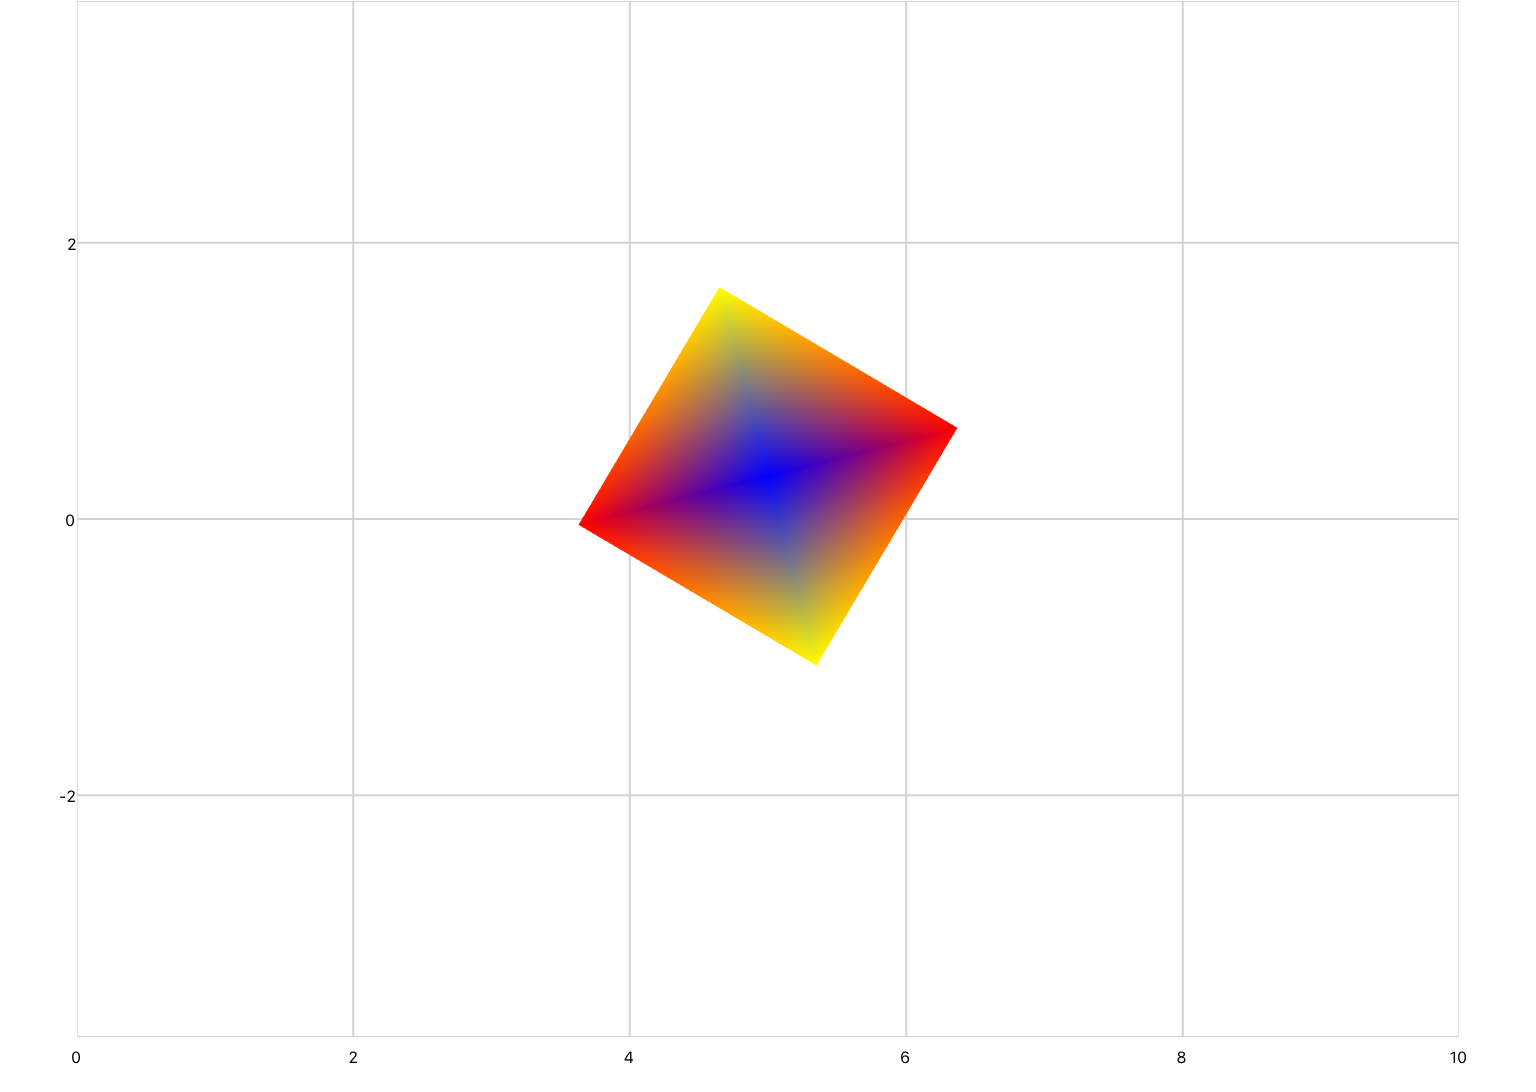
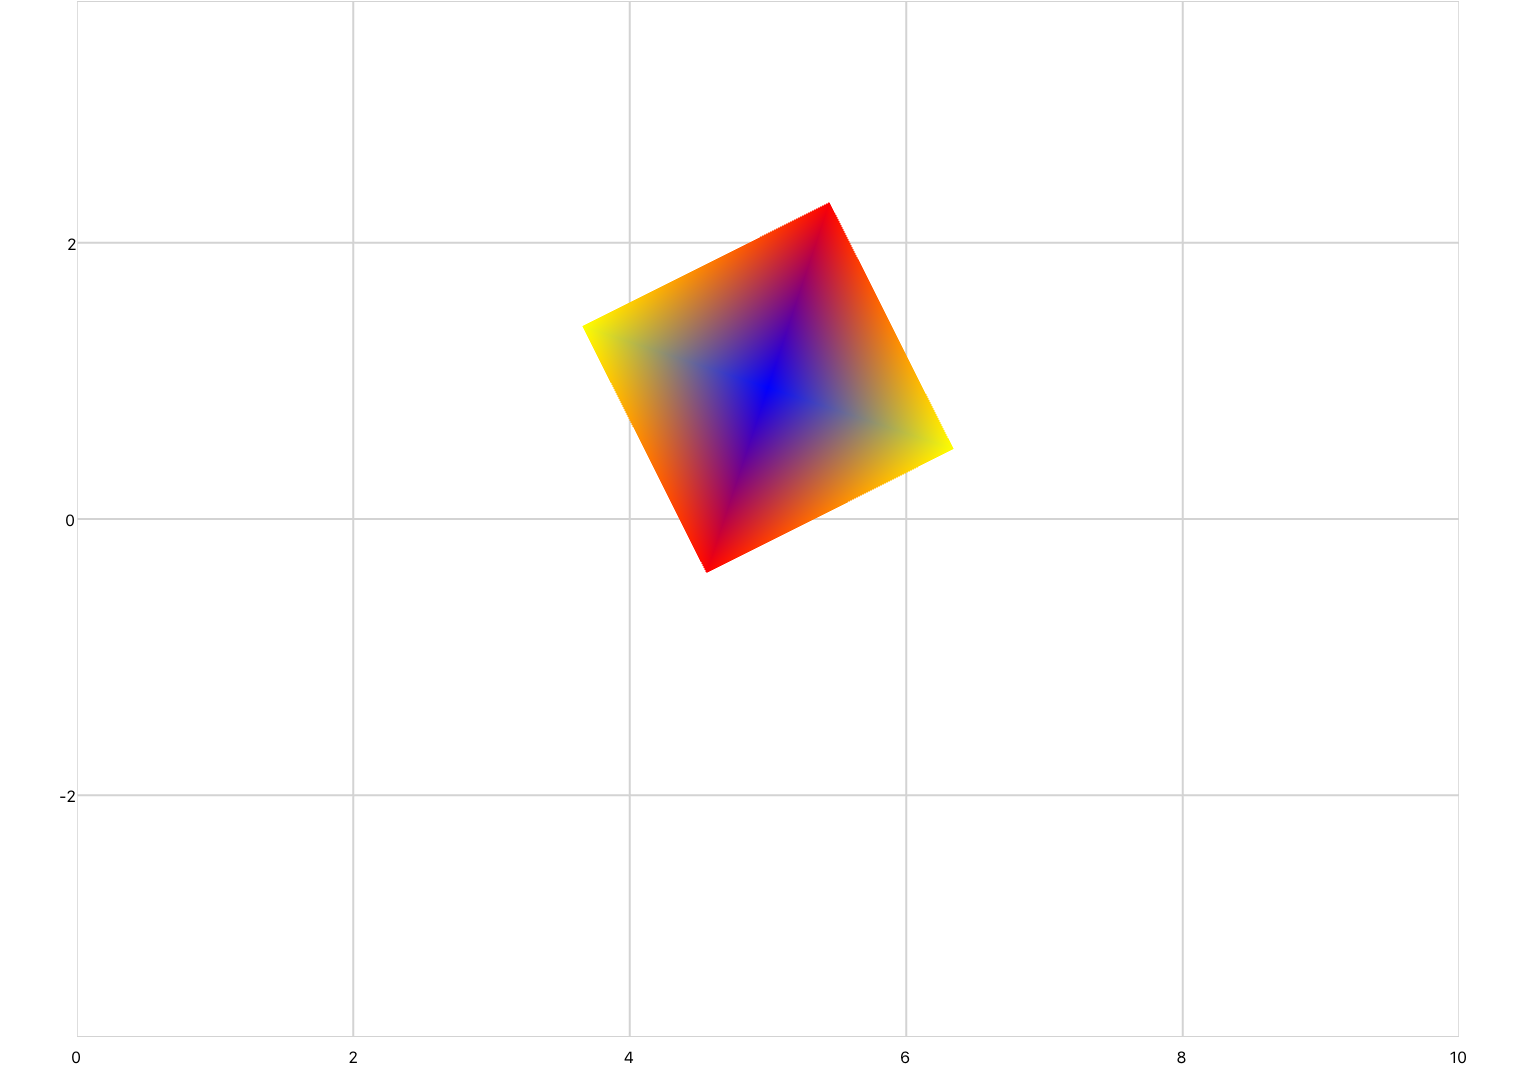
This example uses a simulation to rotate and translate a square. The square is rotated about its center, and is also shifted up and down with the amplitude of a sine wave. In order to rotate the shape about its center it must first be translated to the origin, rotated, then translated back.
<xyPlot name="thisPlot">
  <axis dim="x" auto="fixed" min="0" max="10" />
  <axis dim="y" auto="lockAspectRatio" />
  <series name="series" draw="radialFill">
    <data>5 0; 6 1; 6 -1; 4 -1; 4 1; 6 1</data>
    <colors>blue; red; yellow; red; yellow; red</colors>
  </series>
</xyPlot>

<simulation name="sim" period="0.1">
  <onActivePageChanged>
    if active then sim:Start() else sim:Stop() end
  </onActivePageChanged>
  <solver>
    <series>
      <sine frequency="0.25" />
      <system>
        <input name="amp" width="1" />
        <onOutputs>
          sineAmp = amp[1]
          -- Transform order R to L: Translate in X by -5, Rotate, Translate in X by +5, Translate in Y by sineAmp
          thisPlot.series.Transform = matrixf.translation(0, sineAmp, 0)*matrixf.translation(5,0,0)*matrixf.rotationAboutAxis(0, 0, 1, time)*matrixf.translation(-5,0,0)
        </onOutputs>
      </system>
    </series>
  </solver>
</simulation>