
Draw Modes
The qdex framework allows you to plot raw data by inputting the (x,y) values directly. By default, all points inside of a single data series will be connected with a line. This can be changed using the draw attribute inside of a series tag.
Line (Default)
In the following example we will be plotting two sets of data on a single plot.
Data Set 1: (1, 6) (5, 4) (9, 8) (14, 10)
Data Set 2: (2, 4) (4, 9) (8, 1) (12, 7)
<xyPlot>
  <series>
    <data>1 6; 5 4; 9 8; 14 10</data>
  </series>
  <series draw="line">
    <data>2 4; 4 9; 8 1; 12 7</data>
  </series>
</xyPlot>

Points
This drawing mode draws a single square point for each defined (x,y).
<xyPlot>
  <series draw="points">
    <data>1 6; 5 4; 9 8; 14 10</data>
  </series>
  <series draw="points">
    <data>2 4; 4 9; 8 1; 12 7</data>
  </series>
</xyPlot>

line Segments
This drawing mode draws the series as a sequence of disconnected line segments. Each pair of points defines a line segment. For example, the first series below will draw a line between (1,6) and (5,4), then a line between (9,8) and (14,10). This drawing mode can be used to make dotted lines.
<xyPlot>
  <series draw="lineSegments">
    <data>1 6; 5 4; 9 8; 14 10</data>
  </series>
  <series draw="lineSegments">
    <data>8 1; 8.5 1.5; 9 2; 9.5 2.5; 10 3; 10.5 3.5; 11 4; 11.5 4.5; 12 5</data>
  </series>
</xyPlot>

Closed Lines
The closedLine drawing mode is similar to the line mode, except that the last point and the first point are also connected. This drawing mode is helpful when drawing shapes.
<xyPlot>
  <series draw="closedLine">
    <data>1 6; 5 4; 9 8</data>
  </series>
  <series draw="closedLine">
    <data>4 9; 2 9; 2 7; 4 7</data>
  </series>
</xyPlot>

Triangles
This drawing mode draws the points as a series of filled, disconnected triangles. Every three points defines a new triangle. Extra points are not drawn, like point (4,7) in the second series below.
<xyPlot>
  <series draw="triangles">
    <data>1 6; 5 4; 9 8; 0 2; 1 3; 0 5</data>
  </series>
  <series draw="triangles">
    <data>4 9; 2 9; 2 7; 4 7</data>
  </series>
</xyPlot>

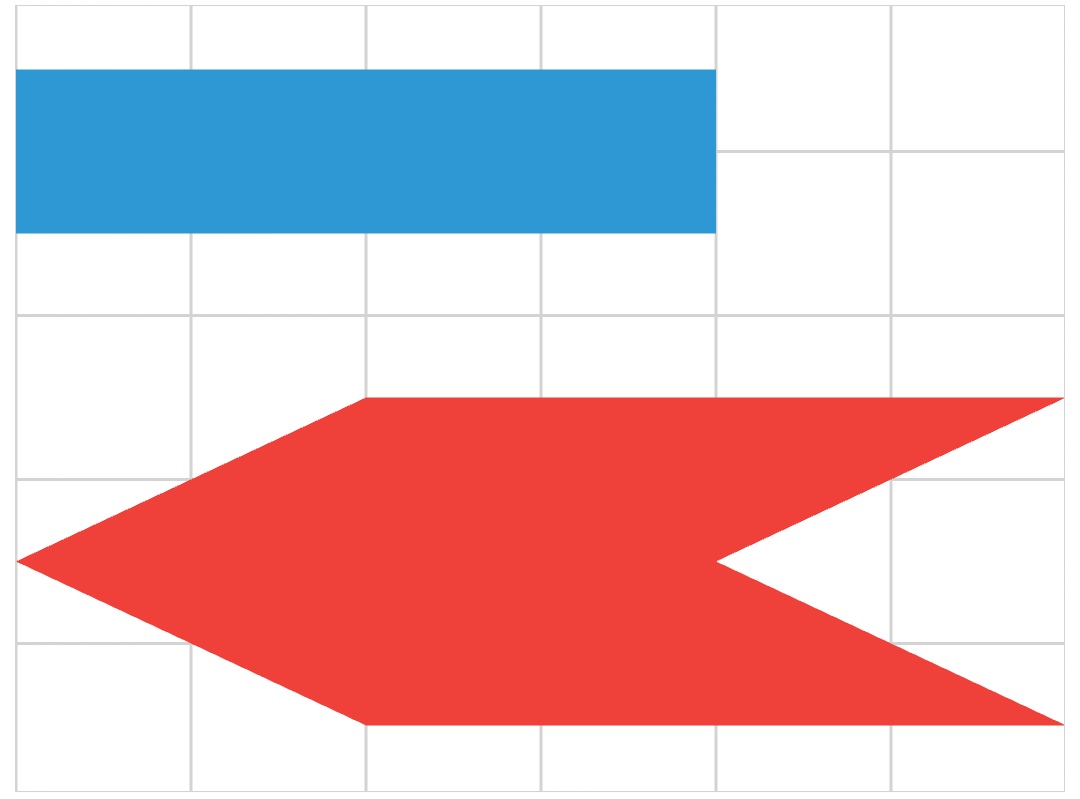
Segmented Fill
The segmentedFill drawing mode draws the points as a series of filled, connected triangles. Each overlapping triplet of points defines a triangle. For example:
Data: (0, 0) (1, 1) (8, 0) (7, 1) (8, 3) (7, 2) (0, 3) (1, 2) (0, 0) (1, 1)
Triangle 1: (0, 0) (1, 1) (8, 0)
Triangle 2: (1, 1) (8, 0) (7, 1)
Triangle 3: (8, 0) (7, 1) (8, 3) etc.
<xyPlot>
  <series draw="segmentedFill">
    <data>0 0; 1 1; 8 0; 7 1; 8 3; 7 2; 0 3; 1 2; 0 0; 1 1</data>
  </series>
  <series draw="segmentedFill">
    <data>4 9; 2 9; 2 7; 4 7</data>
  </series>
</xyPlot>

Radial Fill
This drawing mode draws points as a series of filled, connected triangles, where the first point is shared by all triangles. Each subsequent overlapping pair of points defines a new triangle. For example:
Data: (4, 3) (5, 5) (3, 5) (2, 3) (3, 1) (5, 1)
Triangle 1: (4, 3) (5, 5) (3, 5)
Triangle 2: (4, 3) (3, 5) (2, 3)
Triangle 3: (4, 3) (2, 3) (3, 1) etc.
<xyPlot>
  <series draw="radialFill">
    <data>4 3; 5 5; 3 5; 2 3; 3 1; 5 1</data>
  </series>
  <series draw="radialFill">
    <data>4 9; 2 9; 2 7; 4 7</data>
  </series>
</xyPlot>