Accelerometer 

Accelerometers can be used to find the acceleration of a device. You can access this data from qdex using an accelerometer tag, then use it to control interactions and plots. Accelerations are output in units of metres per second squared.

The accelerometer data is stored inside of an inherent vector called value inside of the onValueChanged event. As with simulations, qdex will not start to read accelerometer data until the accelerometer is started using the Start() method, or signalled from a simulation. 
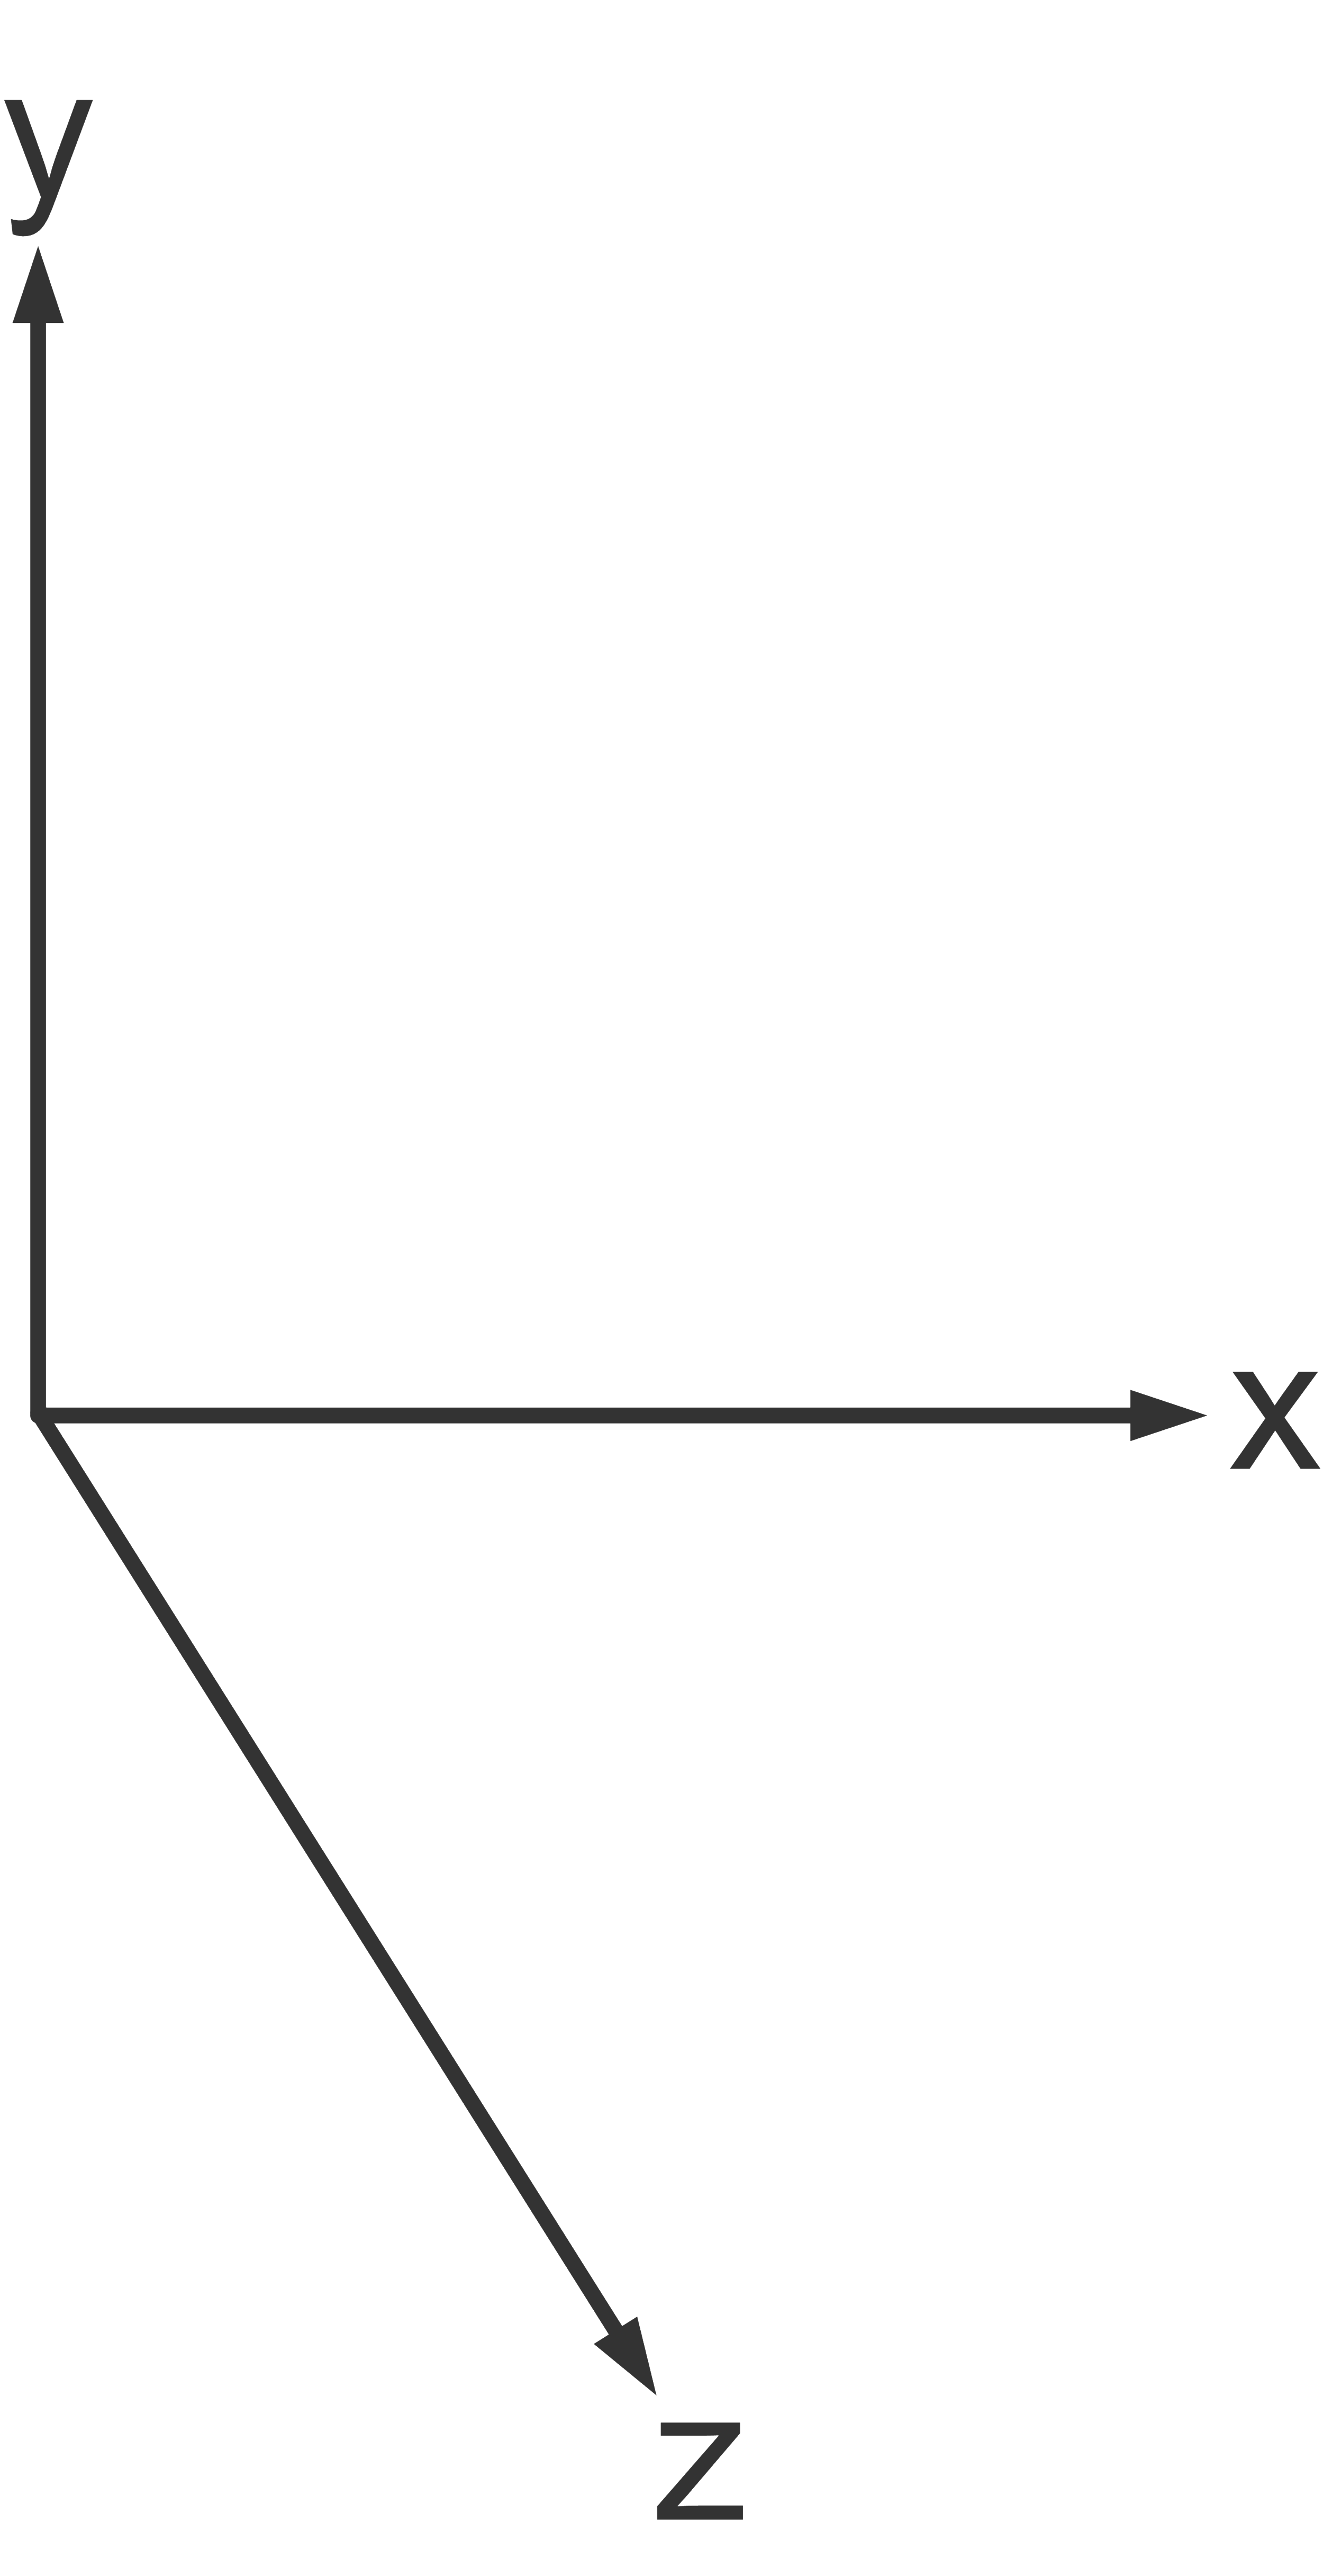
 
acceleromter-orientation.jpg
 
phone-x-axis.jpg

value[1]
Movement along the x-axis

phone-y-axis.jpg

value[2]
Movement along the y-axis

phone-z-axis.jpg

value[3]
Movement along the z-axis

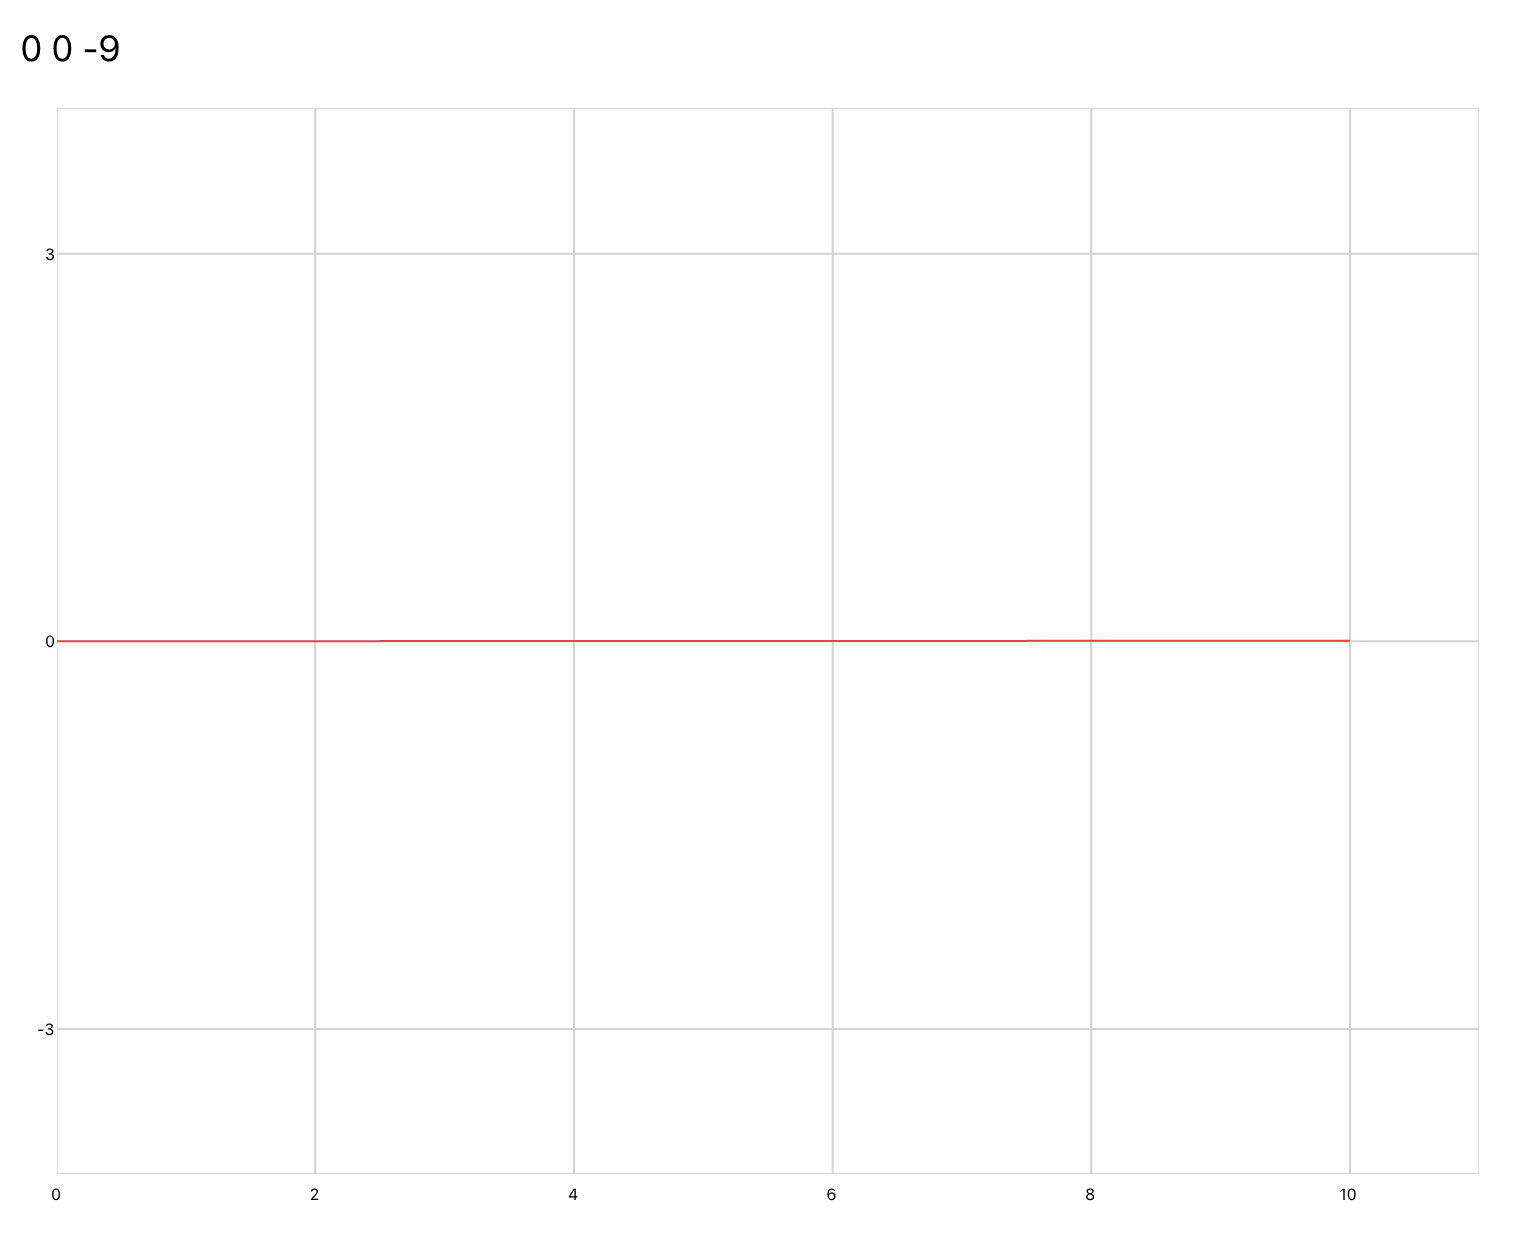
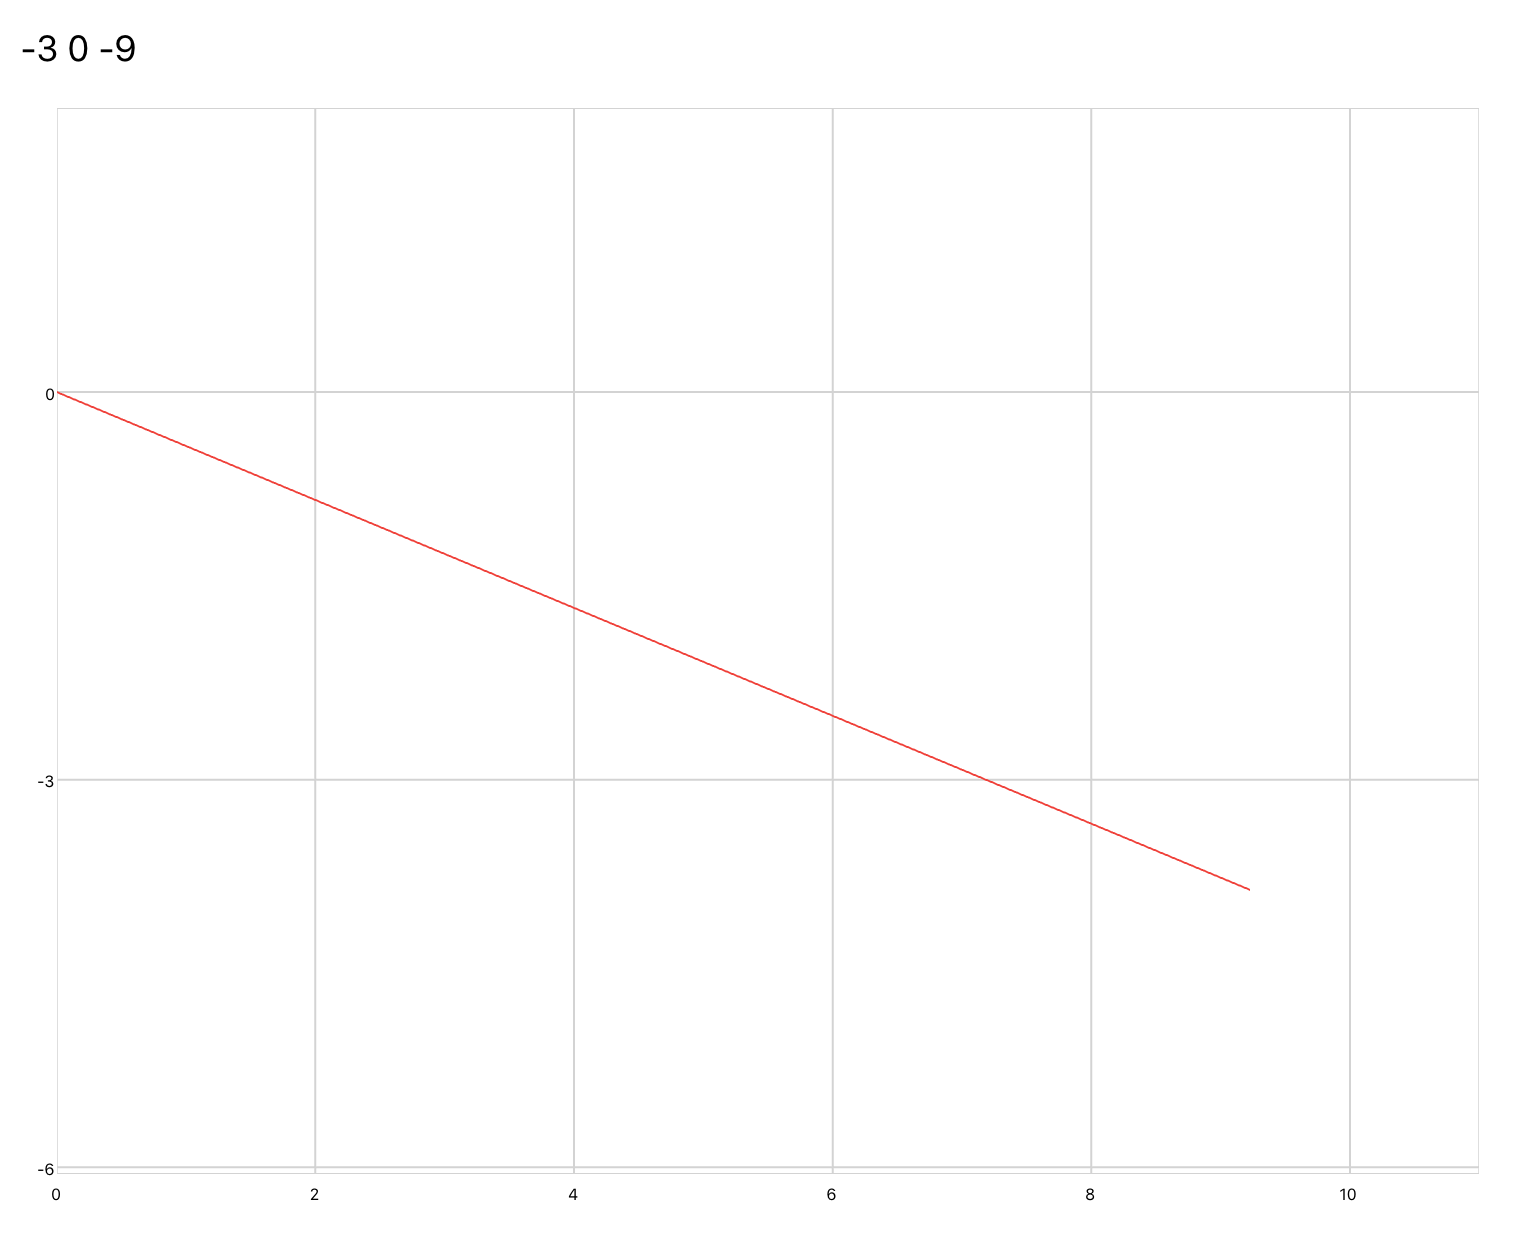
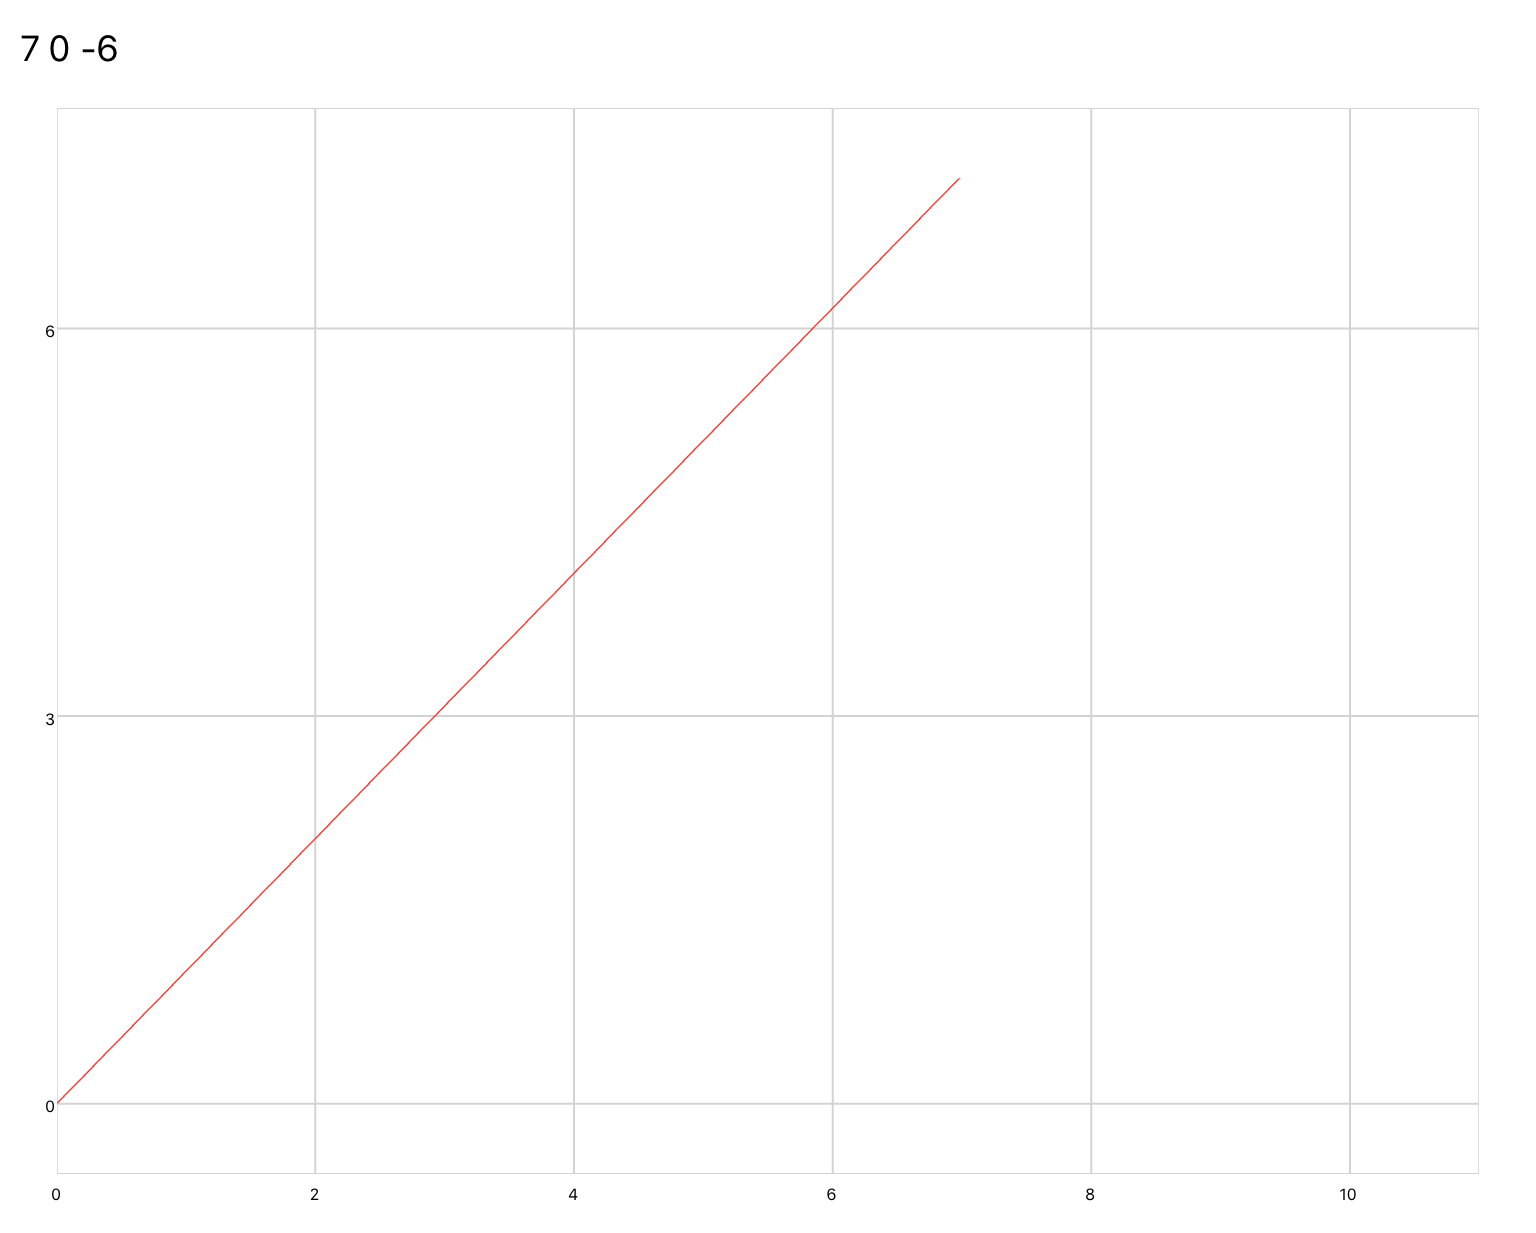
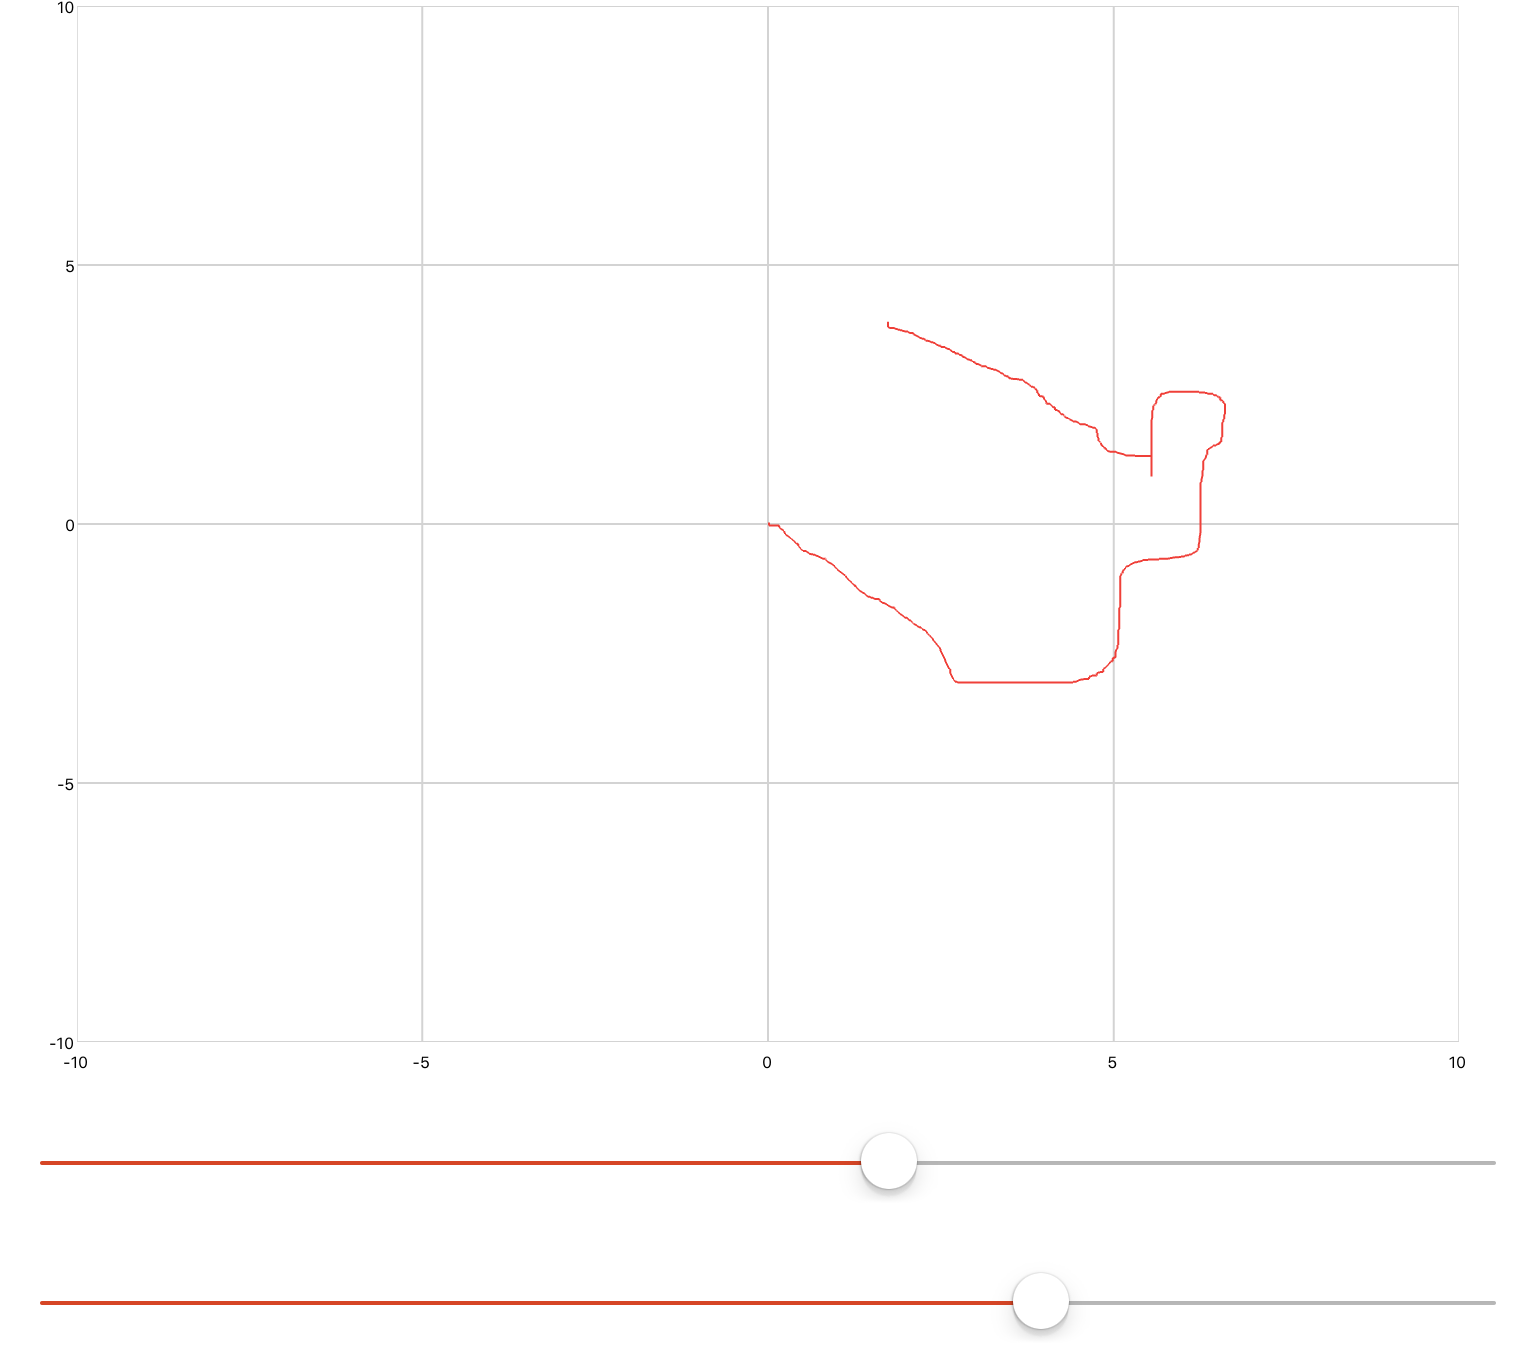
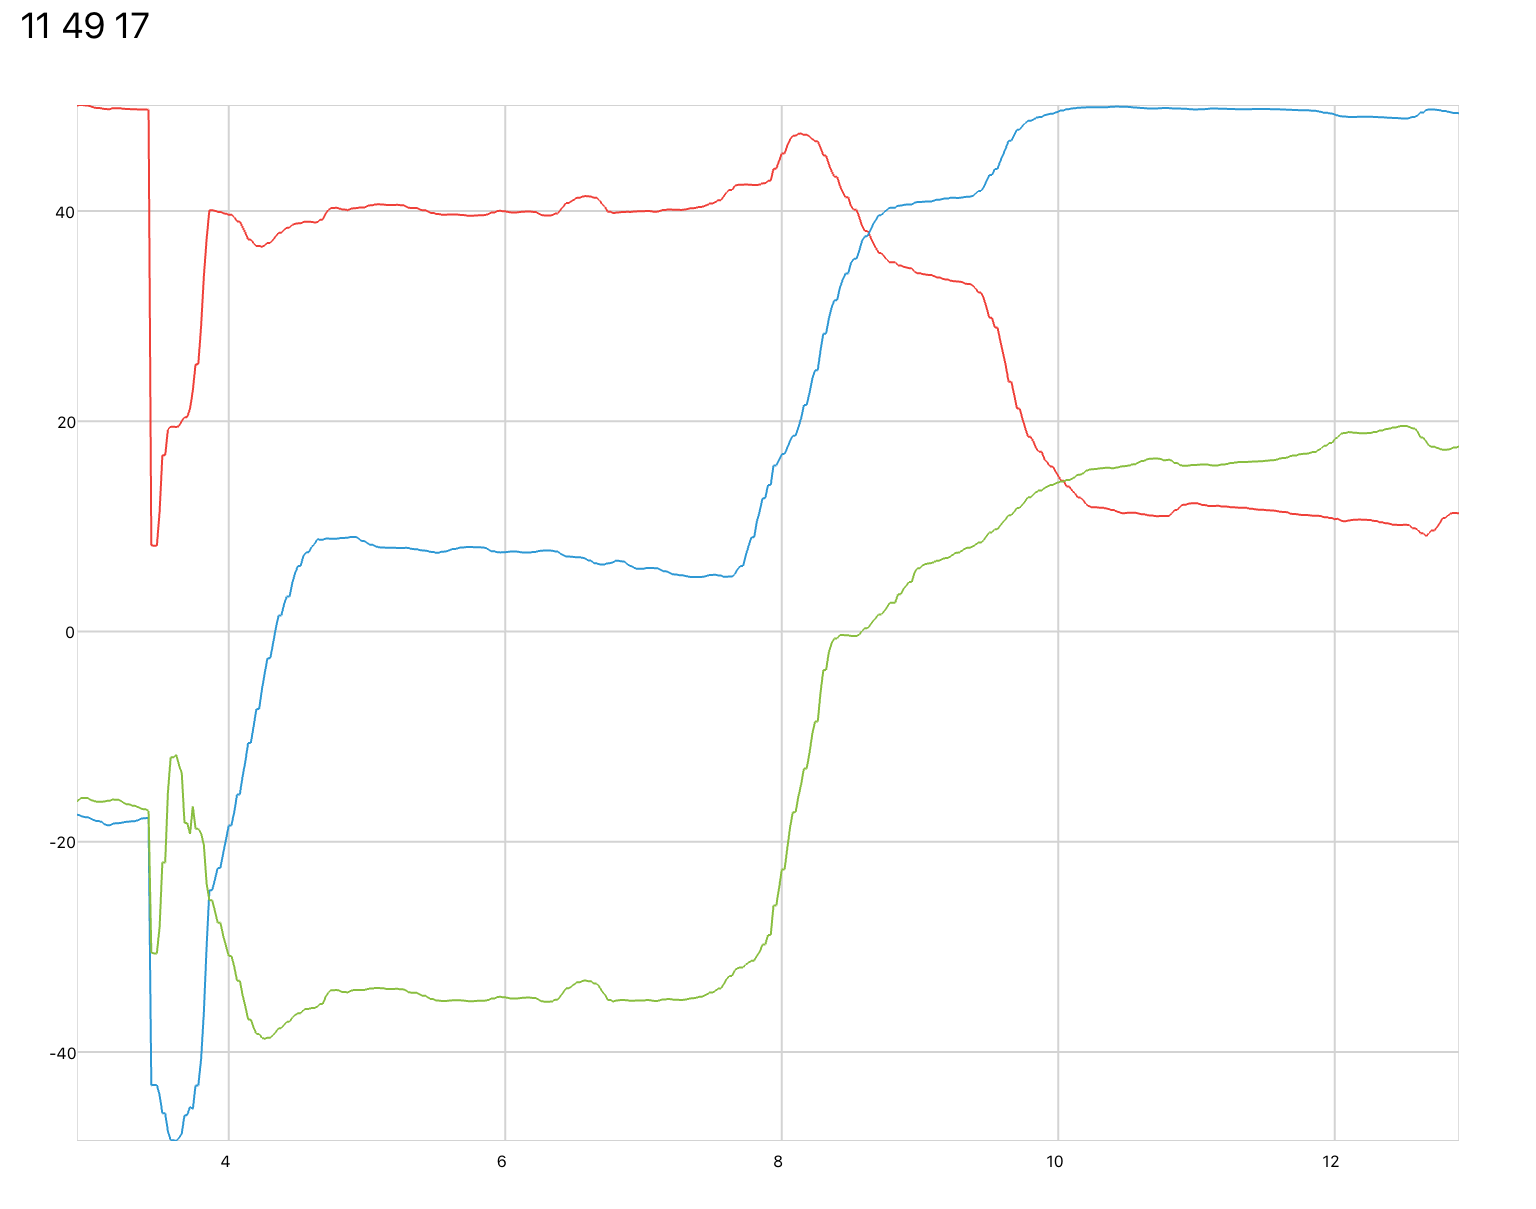
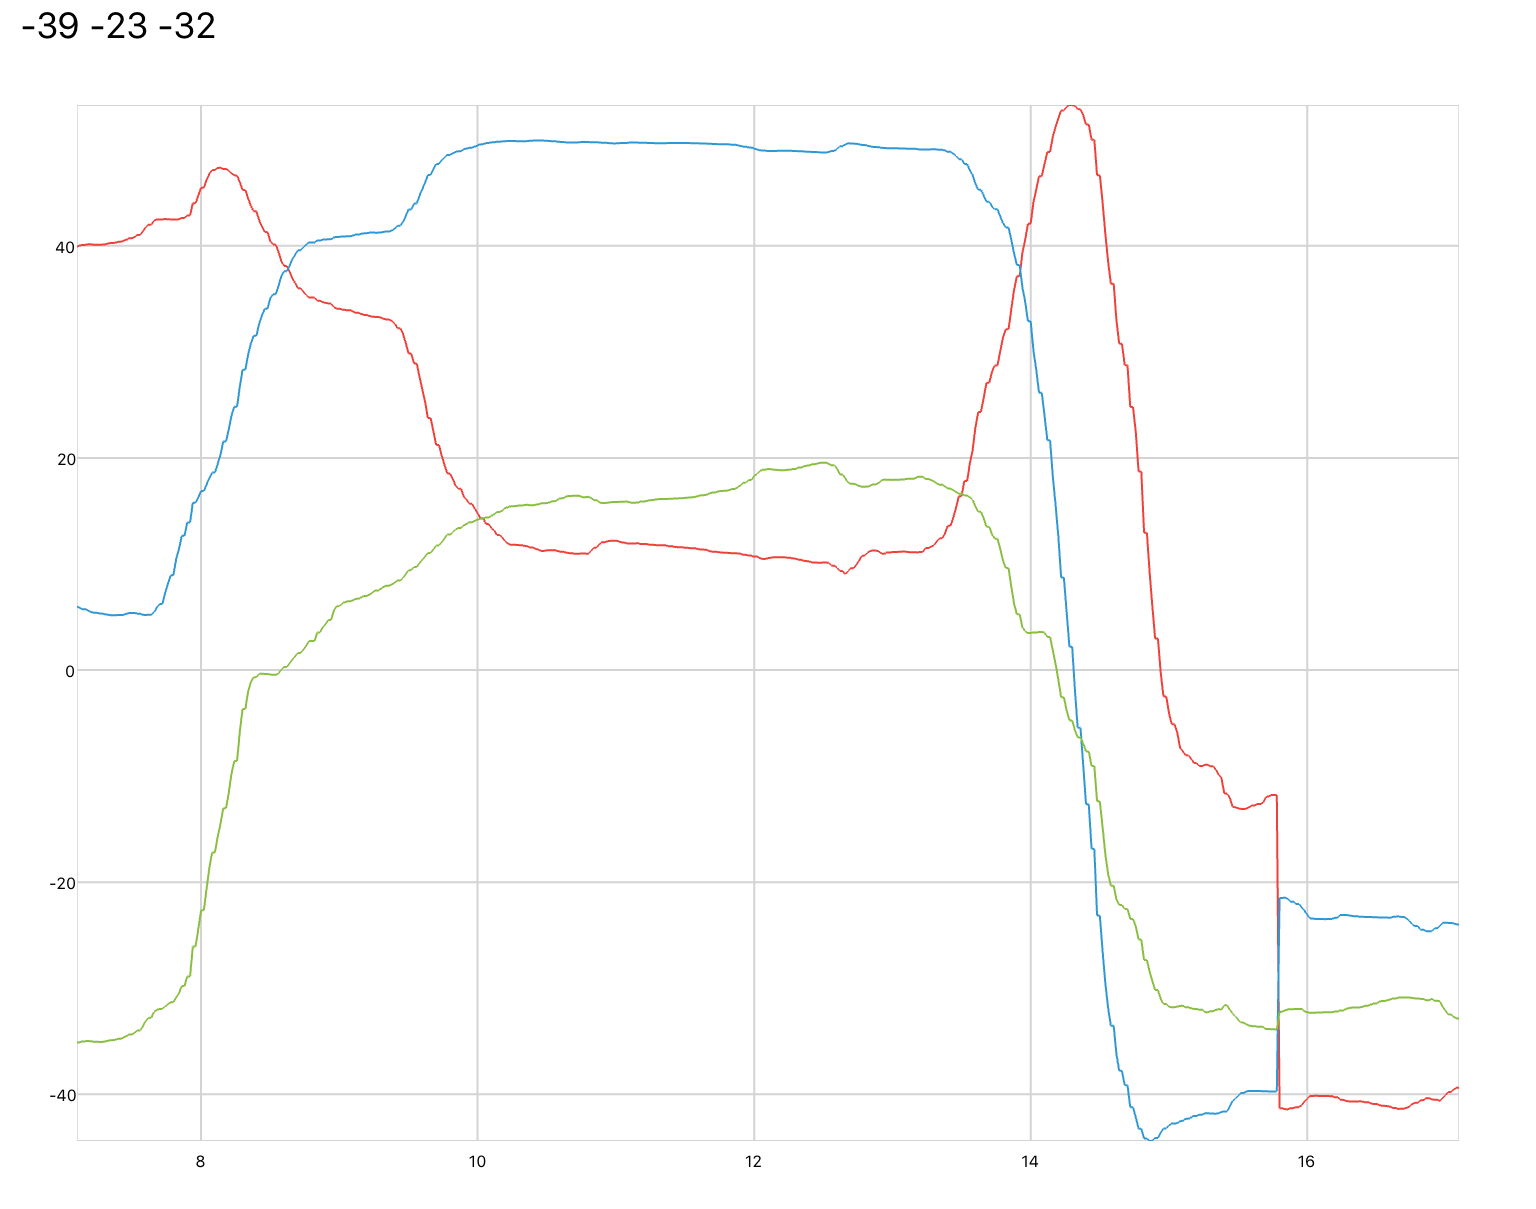
In the example below, the accelerometer data is output to a label, and used to change the angle of a line on a plot. The accelerometer begins to read data when the page is active

<script>
  local x,y;
  local h = 10;
  local myLine = thisPlot.plotLine;
</script>

<accelerometer name="myAccel">
  <onActivePageChanged>
    if active then
    myAccel:Start()
    else
    myAccel:Stop()
    end
  </onActivePageChanged> 
  <onValueChanged>
    myLabel.Text = string.format("%d %d %d", value[1], value[2], value[3])
    
    y = value[1]
    x = math.sqrt(h*h - y*y)
    myLine:Add(0,0)
    myLine:Add(x,y)
    myLine:Update()        
  </onValueChanged>
</accelerometer>

<label name="myLabel" />

<xyPlot name="thisPlot">
  <axis dim="x" auto="fixed" min="0" max="11" />
  <axis dim="y" auto="lockAspectRatio" />
  <series name="plotLine" manual="true" capacity="2" />
</xyPlot>


Gyroscope

Gyroscopes can be used to find the speed of rotation of a device. You can access this data using the gyroscope tag. Rotation speeds are output in units of radians per second. 

The gyroscope data is stored inside of an inherent gyroscope vector called value inside of the onValueChanged event. As with simulations, qdex will not start to read gyroscope data until the gyroscope is started using the Start() method, or signalled from a simulation. 

 
gyroscope-orientation.jpg
 
phone-rotate-x-axis.jpg

value[1]
Rotation around the x-axis

phone-rotate-y-axis.jpg

value[2]
Rotation around the y-axis

phone-rotate-z-axis.jpg

value[3]
Rotation around the z-axis

In the example below, two sliders are used to draw coordinates on a plot. When the tablet is rotated around the z-axis the drawings on the plot are cleared.

This example must be placed inside of a section called mySection in order to be used as-is. 

<gyroscope name="gyro" />

<simulation name="mySim" duration="120" period="0.01">
  <onActivePageChanged>
    if active then
    mySim:Start()
    else
    mySim:Stop()
    end
  </onActivePageChanged>
  <solver>
    <series>
      <signal ref="mySection.gyro" width="3" />
      <system>
        <input name="myInput" width="3" />
        <onOutputs>
           <![CDATA[
              if myInput[3] > 10 then
                myPlot.mySeries:Clear();
              end
            ]]>
        </onOutputs>
      </system>
    </series>
  </solver>
</simulation>

<xyPlot name="myPlot">
  <axis dim="x" auto="fixed" min="-10" max="10" />
  <axis dim="y" auto="fixed" min="-10" max="10" />
  <series name="mySeries" />
</xyPlot>

<slider name="sliderX" min="-10" max="10" value="0">
  <onValueChanged>
    myPlot.mySeries:Add(value, sliderY.Value)
  </onValueChanged>
</slider>

<slider name="sliderY" min="-10" max="10" value="0">
  <onValueChanged>
    myPlot.mySeries:Add(sliderX.Value, value)
  </onValueChanged>
</slider>


Magnetometer

Magnetometers can be used to measure the magnetic fields around a device. You can access this data from qdex using an magnetometer tag. Magnetic fields are output in units of microteslas (one gauss is 100 microteslas). 

The magnetometer data is stored inside of an inherent vector called value inside of the onValueChanged event. As with simulations, qdex will not start to read magnetometer data until the magnetometer is started using the Start() method, or signaled from a simulation. 

In the following example, the values from the magnetometer are plotted and output to a label. 

You can copy this example into your document as-is. It must be contained in a section named section1.

<p name="myLabel" />

<magnetometer name="magnet">
  <onValueChanged>
    myLabel.Text = string.format("%d %d %d", value[1], value[2], value[3])
  </onValueChanged>
</magnetometer>

<simulation name="sim">
  <onActivePageChanged>
    if active then
    sim:Start()
    else
    sim:Stop()
    end
  </onActivePageChanged>
  <solver>
    <series>
      <signal ref="section1.magnet" width="3" />
      <probe ref="section1.magPlot" />
    </series>
  </solver>
</simulation>

<timePlot name="magPlot" series="3" />


Location

The location sensor can be used to access the location of the device. The sensor combines the WiFi, cellular, and GPS data from the device to determine the location. This data can be accessed using the location tag. 

The location data is stored inside of an inherent vector called value inside of the onValueChanged event. value is an object with the following fields:

  1. Latitude - measured in degrees
  2. Longitude - measured in degrees
  3. Altitude - measured in metres above sea level
  4. Speed - measured in metres per second
  5. Bearing - measured in degrees clockwise from true North
  6. Timestamp - object with fields:
    • Day
    • Month
    • Year
    • Hour
    • Minute
    • Second
    • Milisecond
    • DayOfWeek
    • DayOfYear
    • Ticks

The location sensor also has a field to set the accuracy of the data. The default accuracy balances power consumption with data accuracy. The accuracy settings are as follows:

  1. best
  2. high - accuracy within approximately 3 m
  3. good - accuracy within approximately 10 m
  4. balanced - accuracy within approximately 100 metres
  5. low - accuracy within approximately 1 km
  6. lowest - accuracy within approximately 3 km

As with simulations, qdex will not start to read location data until the sensor is started using the Start() method, or signaled from a simulation.

The location sensor may take upwards of 1-2 minutes to read data.

Example 1

This example uses a simulation to signal the location sensor on a device. The duration of the simulation is defined so that the location sensor can time out, thus reducing battery power consumption.

The simulation reads the location data every 8 seconds to check for updates. Once the data changes from the default value of 0, the labels are updated to reflect the sensor numbers. The notify popup is used to let users know that the sensor is on, but needs time to calculate the location data.

<location accuracy="best" name="myLocation" />

<button name="startButton" content="Get Location Data">
  <onClick>
    mySim:Start()
    notify('Starting Location Sensor')
    startButton.Style.Visibility = "hidden"
  </onClick>
</button>

<simulation name="mySim" period="8" duration="180">
  <onDuration>
    startButton.Style.Visibility = "visible"
  </onDuration>
  <solver>
    <series>
      <signal ref="section1.myLocation" width="5" />
      <system name="myOutput">
        <input name="location" width="5" />
        <onOutputs>
          if myLocation.Latitude == 0 and myLocation.Longitude == 0 and myLocation.Altitude == 0 then
            notify('Calculating...')
          else
            latitudeLabel.Text = string.format("Latitude: %.2f degrees", myLocation.Latitude)
            longitudeLabel.Text = string.format("Longitude: %.2f degrees", myLocation.Longitude)
            altitudeLabel.Text = string.format("Altitude: %.2f metres above sea level", myLocation.Altitude)
            speedLabel.Text = string.format("Speed: %.2f m/s", myLocation.Speed)
            bearingLabel.Text = string.format("Bearing: %.2f degrees CW from North", myLocation.Bearing)
            mySim:Stop()
            startButton.Style.Visibility = "visible"
          end
        </onOutputs>
      </system>
    </series>
  </solver>
</simulation>

<label name="latitudeLabel" />
<label name="longitudeLabel" />
<label name="altitudeLabel" />
<label name="speedLabel" />
<label name="bearingLabel" />
<label name="timestampLabel" />