

Plots for Animation
Sprite-like animations can be drawn in qdex by manually adding, deleting, and updating points on a plot. Simulations are used to calculate time or the dynamics of the drawn system, and (x,y) points are added on each iteration. If you would like to add images to your plots and manipulate them with controls or through simulation, refer to Texture Basics.
Example 1
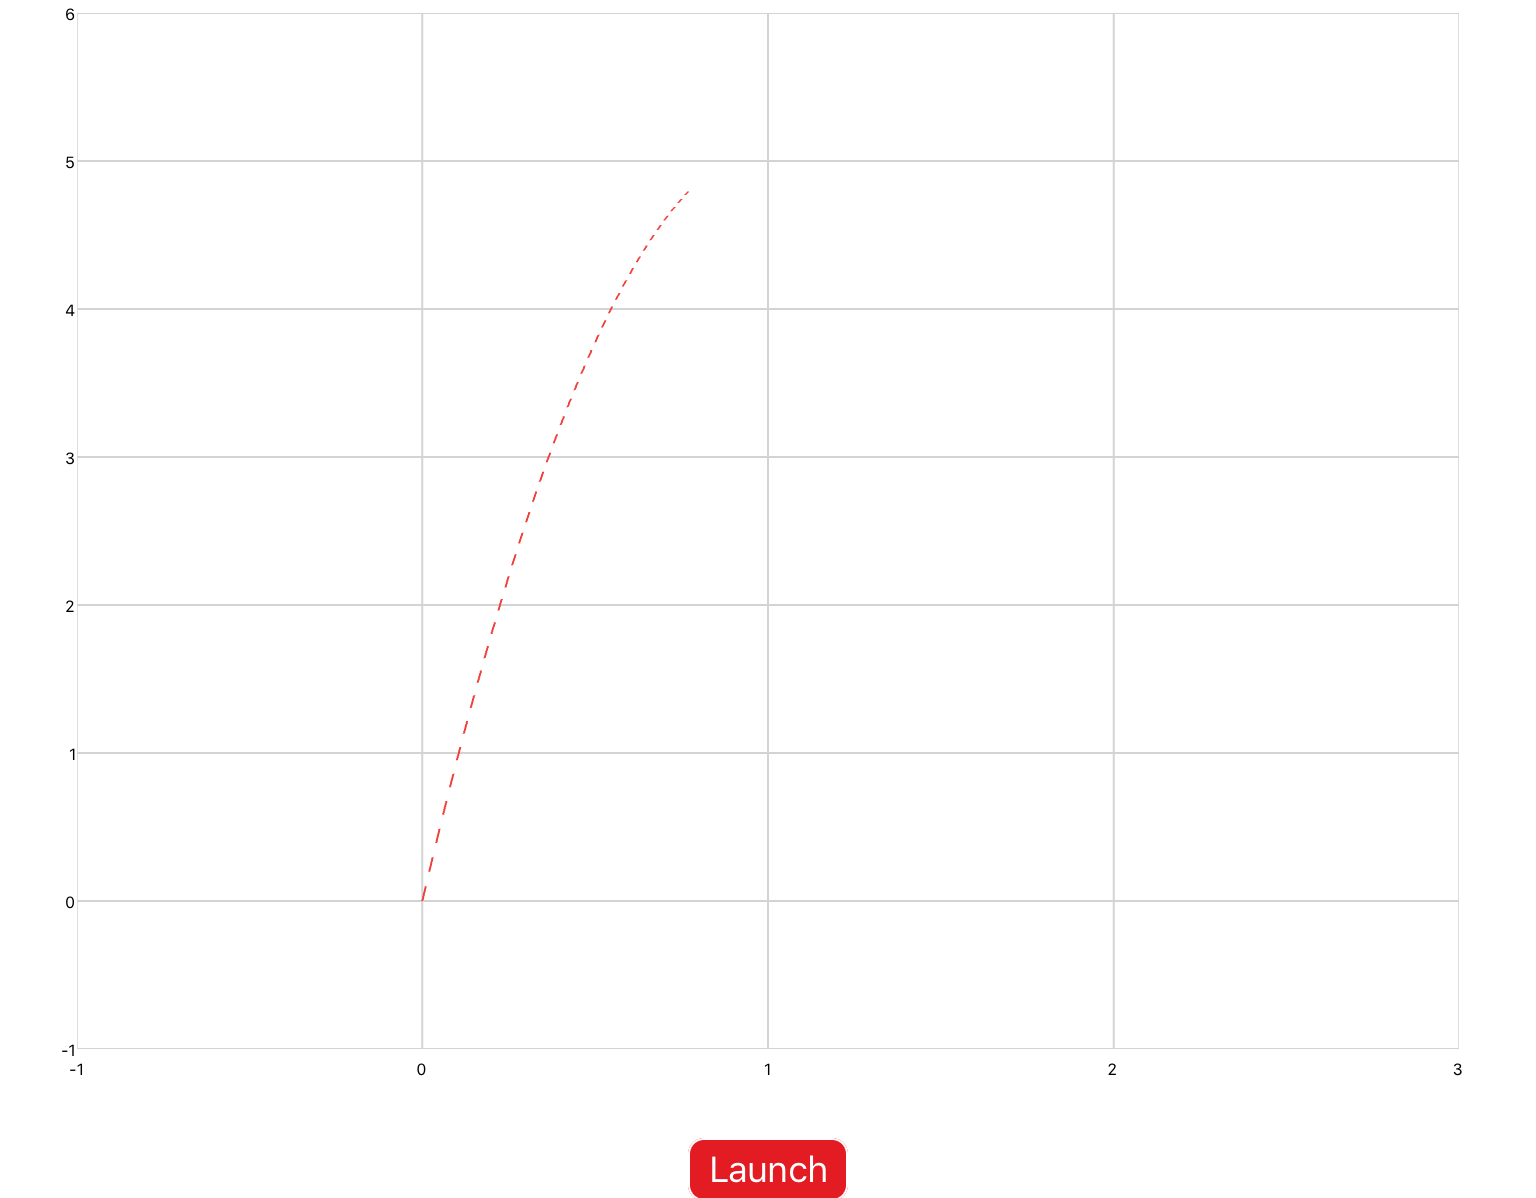
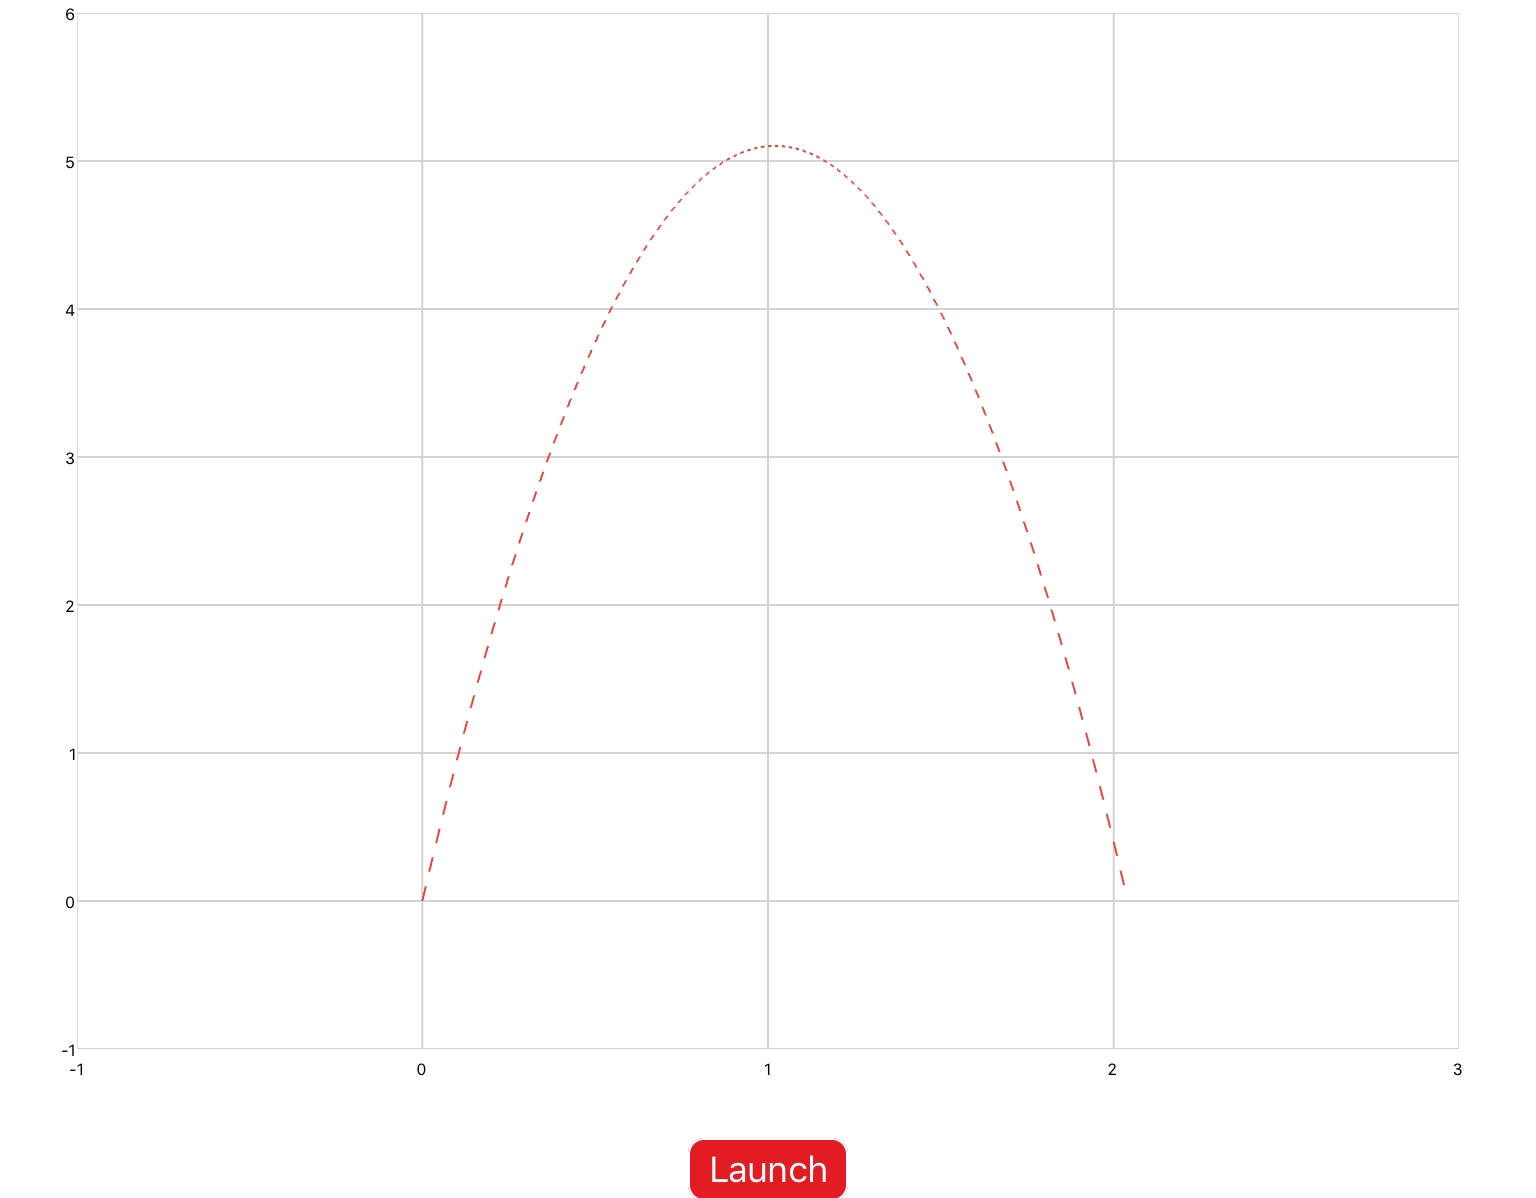
In this example, a simulation is used to calculate the current time of a projectile after launch. A button is used to start the simulation (i.e. launch the projectile). When the simulation runs it updates the current time and calls a function to draw the projectile. The function also checks that the y-value of the current position is greater than 0 so that the projectile stops when it hits the "ground".
The series' manual attribute is set to true, meaning that (x,y) coordinates will not be added or removed from the series until you call the Update method (See Plot Flickering below for more information). The plot is also cleared each time the button is pushed to allow the animation to be redrawn each time the projectile is launched.
You can copy this example into your document as-is.
<sectionNoTitle>
  <xyPlot name="aPlot">
    <axis dim="x" auto="fixed" min="-1" max="3" />
    <axis dim="y" auto="fixed" min="-1" max="6" />
    <series name="arcSeries" manual="true" draw="lineSegments" />
  </xyPlot>

  <script>
    <![CDATA[
    local plotArc = aPlot.arcSeries;
    local curTime = 0;
    local startSpeed = 10;

    local function drawArc()
    y = startSpeed*curTime + 0.5*-9.8*(curTime^2)

    if y >= 0 then
    plotArc:Add(curTime, y)
    plotArc:Update()
    else
    arcSim:Stop()
    end

    end
    ]]>
  </script>

  <button content="Launch">
    <onClick>
      plotArc:Clear()
      arcSim:Start()
    </onClick>
  </button>

  <simulation name="arcSim" period="0.01" duration="5">
    <onUpdate>
      curTime = time;
      drawArc()
    </onUpdate>
  </simulation>
</sectionNoTitle>

Example 2
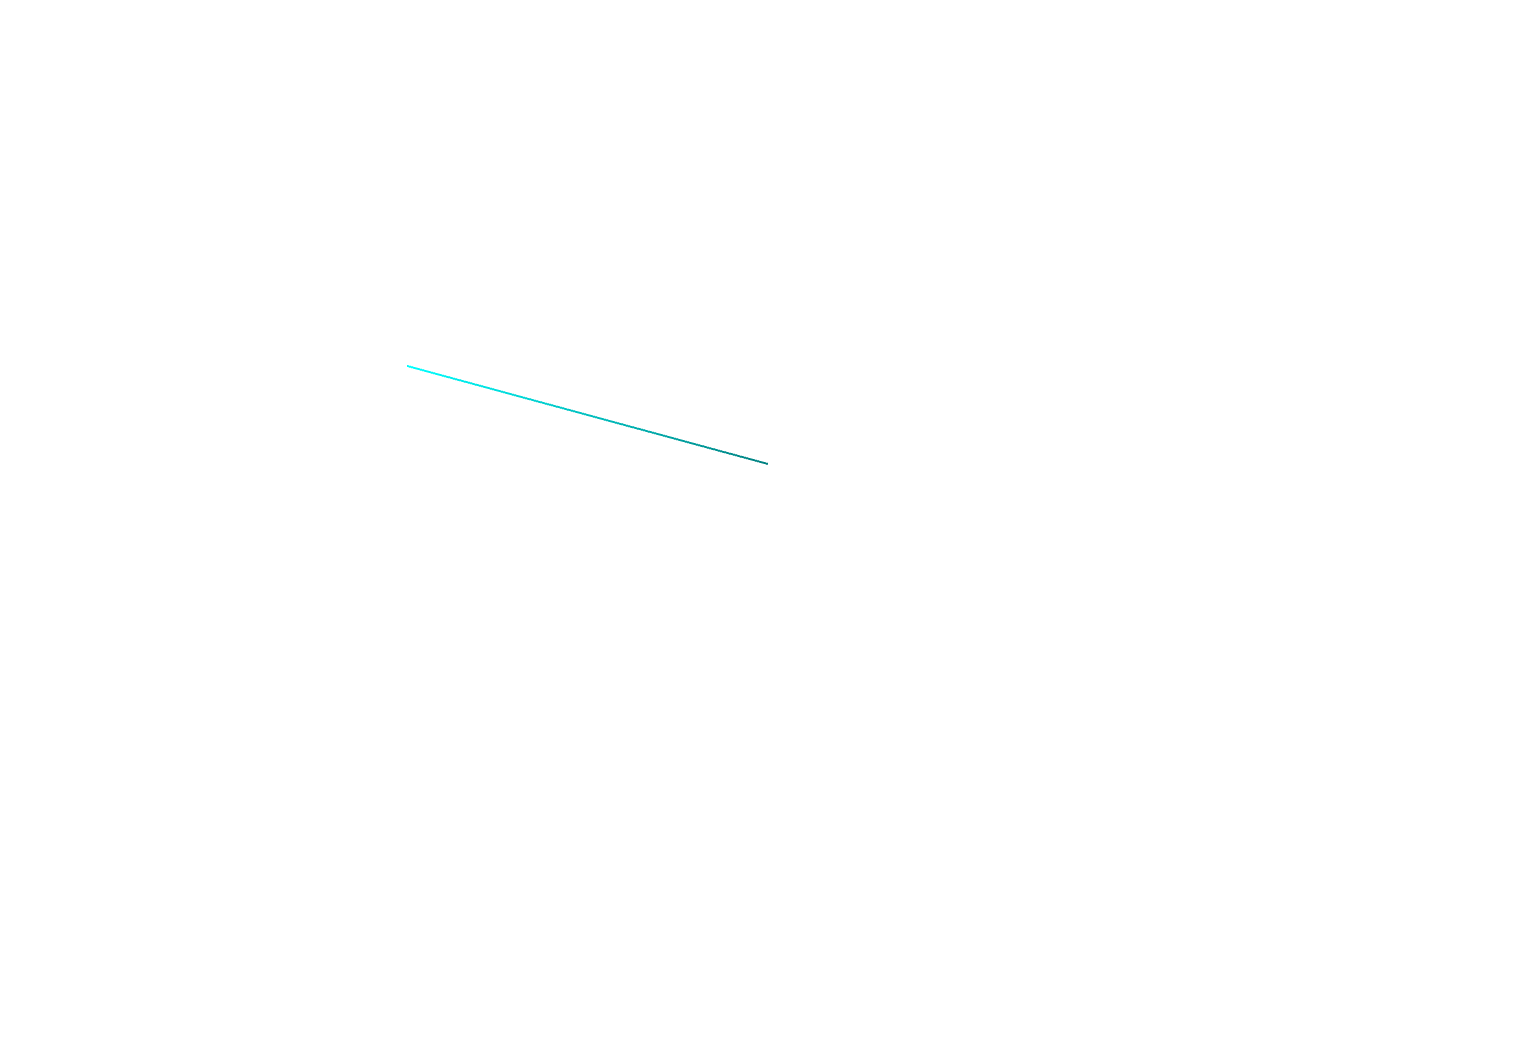
This example uses a custom simulation system to calculate (x,y) coordinates. On each iteration of the simulation the sine and cosine of the simulation clock is calculated, and the points (0,0) and (sine, cosine) are plotted. The result is a two-point line that rotates around a circle.
Note that the capacity of the series is set to 2, as only two points should be plotted at one time. If you do not set the capacity of the series, you can call the Clear method before adding points.
This plot includes a second series of transparent points in a square formation to force the plot to center on the rotating line. If this series was not included, the y axis would shift (due to the lockAspectRatio setting) with the animation, and the (0,0) coordinate would not stay centered. We recommend using this transparent frame method each time you create an animation that uses lockAspectRatio.
You can copy this example into your document as-is.
<sectionNoTitle>
  <drawing name="myAnimation">
    <axis dim="x" auto="fixed" min="-2" max="2" />
    <axis dim="y" auto="lockAspectRatio" />
    <series name="mySeries" manual="true" capacity="2" />
    <series>
      <data>-1 -1; -1 1; 1 1; 1 -1; -1 -1</data>
      <colors>transparent; transparent; transparent; transparent; transparent</colors>
    </series>
  </drawing>

  <script>
    local plotC = myAnimation.mySeries;
  </script>

  <simulation name="circleSim">
    <onActivePageChanged>
      circleSim:Start()
    </onActivePageChanged>
    <solver>
      <series>
        <clock />
        <system>
          <input name="data" width="1" />
          <onOutputs>
            val1 = math.sin(data[1])
            val2 = math.cos(data[1])

            plotC:Add(0,0, color.teal)
            plotC:Add(val1, val2, color.aqua)
            plotC:Update()
          </onOutputs>
        </system>
      </series>
    </solver>
  </simulation>

</sectionNoTitle>


Plot Flickering
If you have attempted to create an animation using a plot in qdex, you may have noticed a lot of flickering when the animation is changed. This is because when animating shapes on plots (that is, drawing/erasing points in quick succession), the user notices the pause between erasing points and adding new points.
You can stop this flickering effect by setting the manual attribute on the series to "true". When manual="true", the series will not erase or add points until the Update method is called. In this way you can erase the old points and add new ones at effectively the same time, removing the flicker altogether.
Animation that Flickers
<script>
  local d = 1

  local function drawShape()
    -- Clear all points
    plot1.shape:Clear()
    -- Draw points
    plot1.shape:Add(-1*d, -1*d)
    plot1.shape:Add(1*d, -1*d)
    plot1.shape:Add(1*d, 1*d)
    plot1.shape:Add(-1*d, 1*d)
    plot1.shape:Add(-1*d, -1*d)
    plot1.shape:Add(0, 0.5*d+d)
    plot1.shape:Add(1*d, 1*d)
  end
</script>


<xyPlot name="plot1">
  <axis dim="x" auto="lockAspectRatio" />
  <axis dim="y" auto="fixed" min="-15" max="20" />
  <series name="shape" draw="segmentedFill" />
</xyPlot>

<slider min="1" max="10">
  <onValueChanged>
    d = value
    drawShape()
  </onValueChanged>
</slider>

Animation that flickers
Animation with Flickering Removed
<script>
  local d = 1

  local function drawShape()
    -- Clear all points
    plot1.shape:Clear()
    -- Draw points
    plot1.shape:Add(-1*d, -1*d)
    plot1.shape:Add(1*d, -1*d)
    plot1.shape:Add(1*d, 1*d)
    plot1.shape:Add(-1*d, 1*d)
    plot1.shape:Add(-1*d, -1*d)
    plot1.shape:Add(0, 0.5*d+d)
    plot1.shape:Add(1*d, 1*d)
    -- Update series
    plot1.shape:Update()
  end
</script>

<xyPlot name="plot1">
  <axis dim="x" auto="lockAspectRatio" />
  <axis dim="y" auto="fixed" min="-15" max="20" />
  <series name="shape" manual="true" draw="segmentedFill" />
</xyPlot>

<slider min="1" max="10">
  <onValueChanged>
    d = value
    drawShape()
  </onValueChanged>
</slider>

Animation with no flicker