Back to Knowledge Base

Textures

Textures allow you to embed images onto a plot. They can be static or animated, and make it easier to enliven the interactions that you add to your module.

Textures are added to a plot using two plot elements, texture and textureCoords. The texture element lets you define which image you will be using in your plot, where as the textureCoords element defines what portion of the image you will be using.

Texture

The texture element must have a name, and contains an image element specifying which image to use. Images can be in PNG or JPEG format, and should not exceed 2048px in width or height. Images less than 1000px dimensionally are recommended.

<texture name="myTextureName">
  <image src="resources/myImage.png" />
</texture>

TextureCoords

The textureCoords element references the image you have added, and allows you to capture an area of your image. Texture coordinates are defined in texture space, and have a minimum value of 0 and a maximum value of 1 in the U and V axes.

 
textureCoords in (U,V) space
 

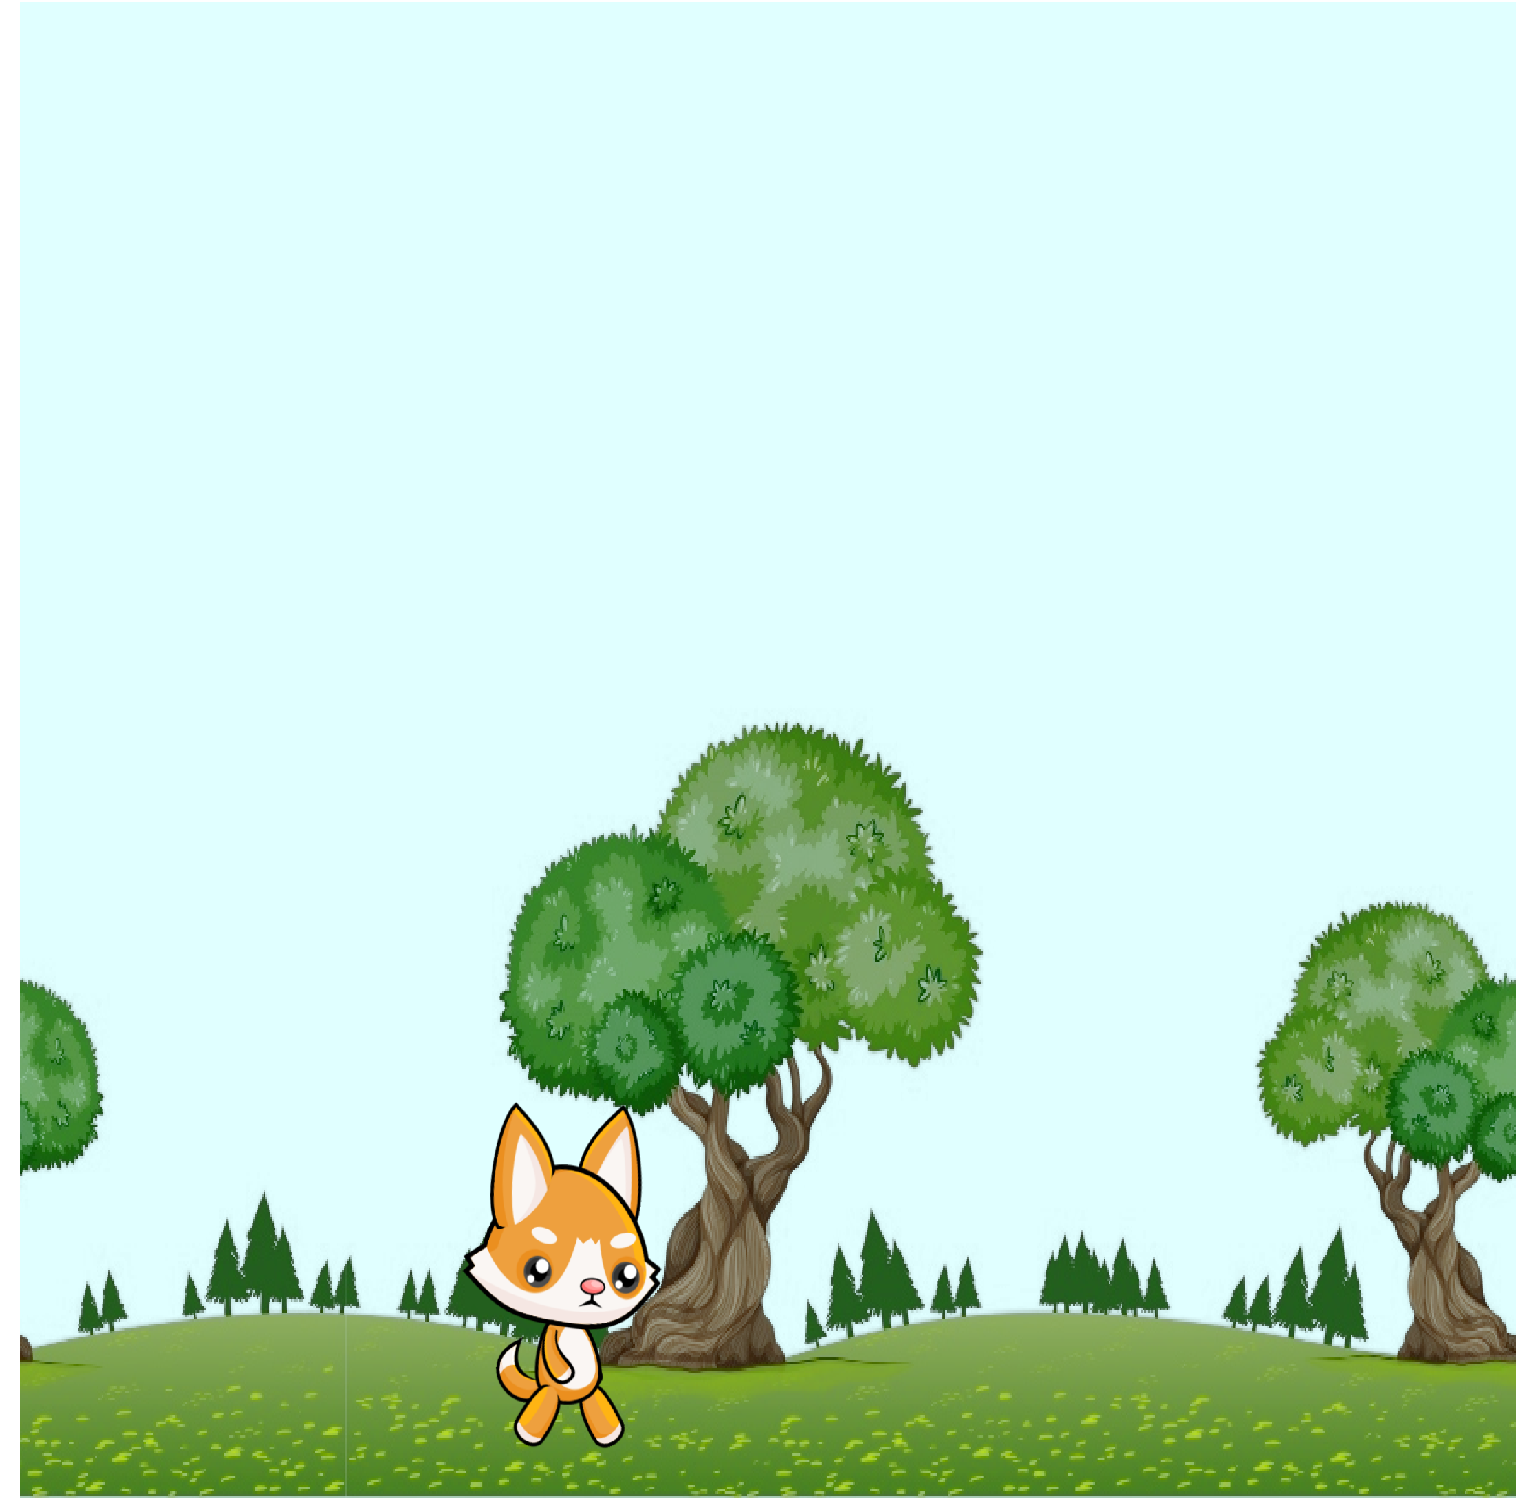
Therefore, if you would like to add the entire image to your plot, your textureCoords could be:

<textureCoords ref="myTextureName">0 0; 0 1; 1 1; 1 0</textureCoords>

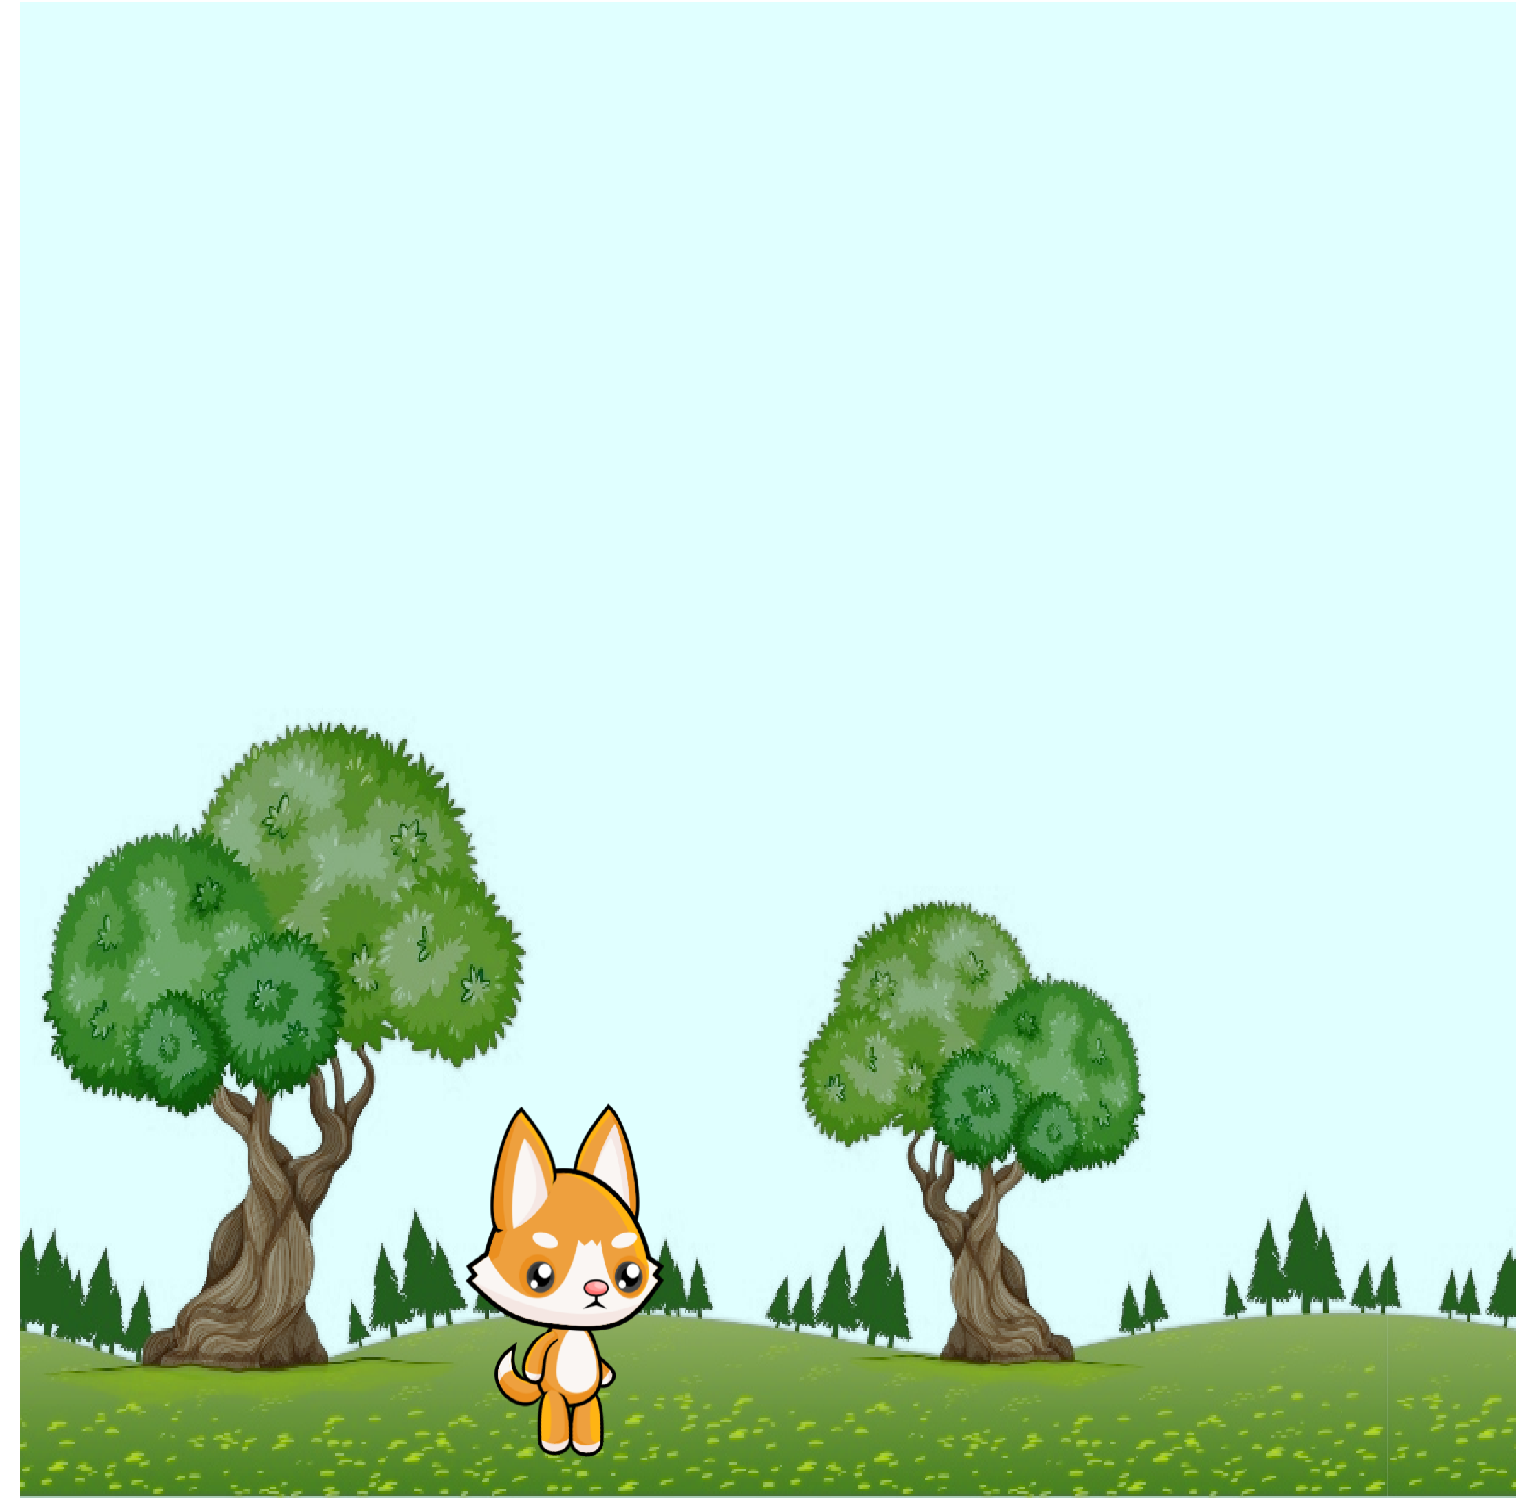
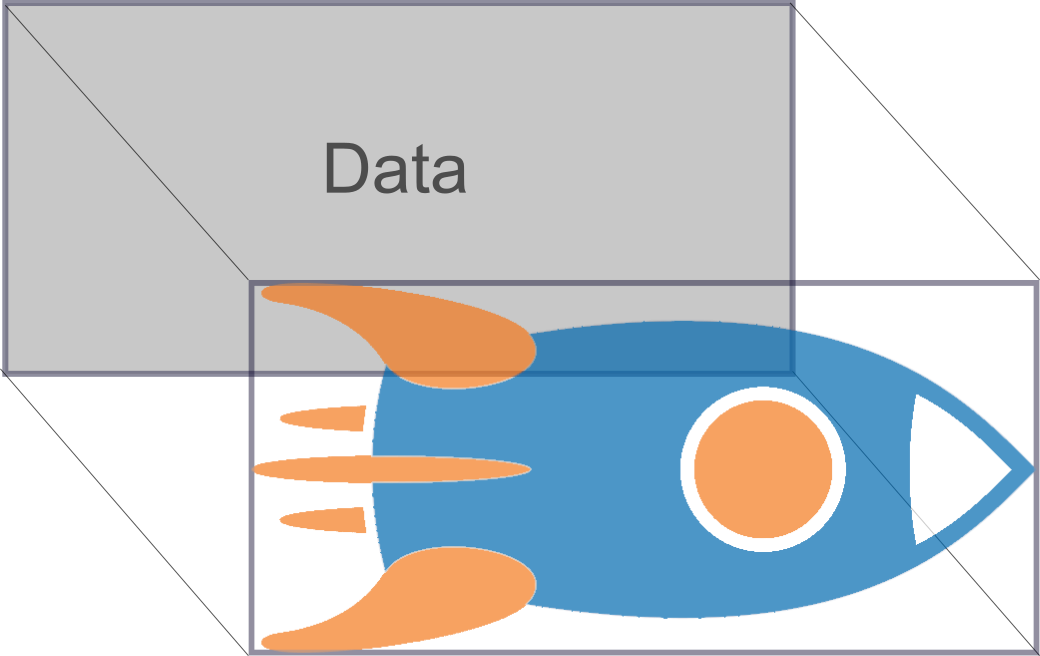
If you would only like to capture half of your image, your textureCoords could be:

<textureCoords ref="myTextureName">0 0; 0 1; 0.5 1; 0.5 0</textureCoords>

resulting in

 
halfRocket.png
 

Draw Style

The draw style is not an element that is exclusive to textures, however it plays an important role in how your textures are captured. The three draw styles that can be used with textures are Triangles, Segmented Fill, and Radial Fill. The draw style that you choose lets you specify how many points of your texture are captured, as well as how they are captured.

For the rocket image above, I could capture the entire rocket in a few ways.

Triangles Draw Mode

Every three points defines a new triangle. Extra points are not drawn.

<series name="myRocket" draw="triangles">
  <textureCoords ref="myTextureName">0 0; 0 1; 1 1; 0 0; 1 0; 1 1</textureCoords>
  ...
</series>
 
rocket triangle 1.png
rocket triangle 2.png
 

Segmented Fill Draw Mode

Each overlapping triplet of points defines a triangle.

<series name="myRocket" draw="segmentedFill">
  <textureCoords ref="myTextureName">0 0; 0 1; 1 1; 1 0; 0 0</textureCoords>
  ...
</series>
 
rocket triangle 1.png
rocket triangle 2b.png
rocket triangle 3.png
 

Radial Fill Draw Mode

A series of triangles where the first point is shared by all triangles. Each subsequent overlapping pair of points defines a new triangle. 

<series name="myRocket" draw="radialFill">
  <textureCoords ref="myTextureName">0 0; 0 1; 1 1; 1 0</textureCoords>
  ...
</series>
 
rocket triangle 1.png
rocket triangle 2.png
 

In the three draw mode examples above I used the least amount of points possible to capture the entire shape. It is possible however to add many more points to capture an image. The more points that are used to capture the texture, the more points there are available to manipulate the shape during animation. 

Data

After we have decided how much of our image to capture and how to capture it, we must specify where in the plot we would like our image to be. The number of data points must be the same as the number of textureCoords, as we are mapping our texture onto the plot data. The texture will distort to fully cover the specified data points.

 
Mapping textureCoords to data
 

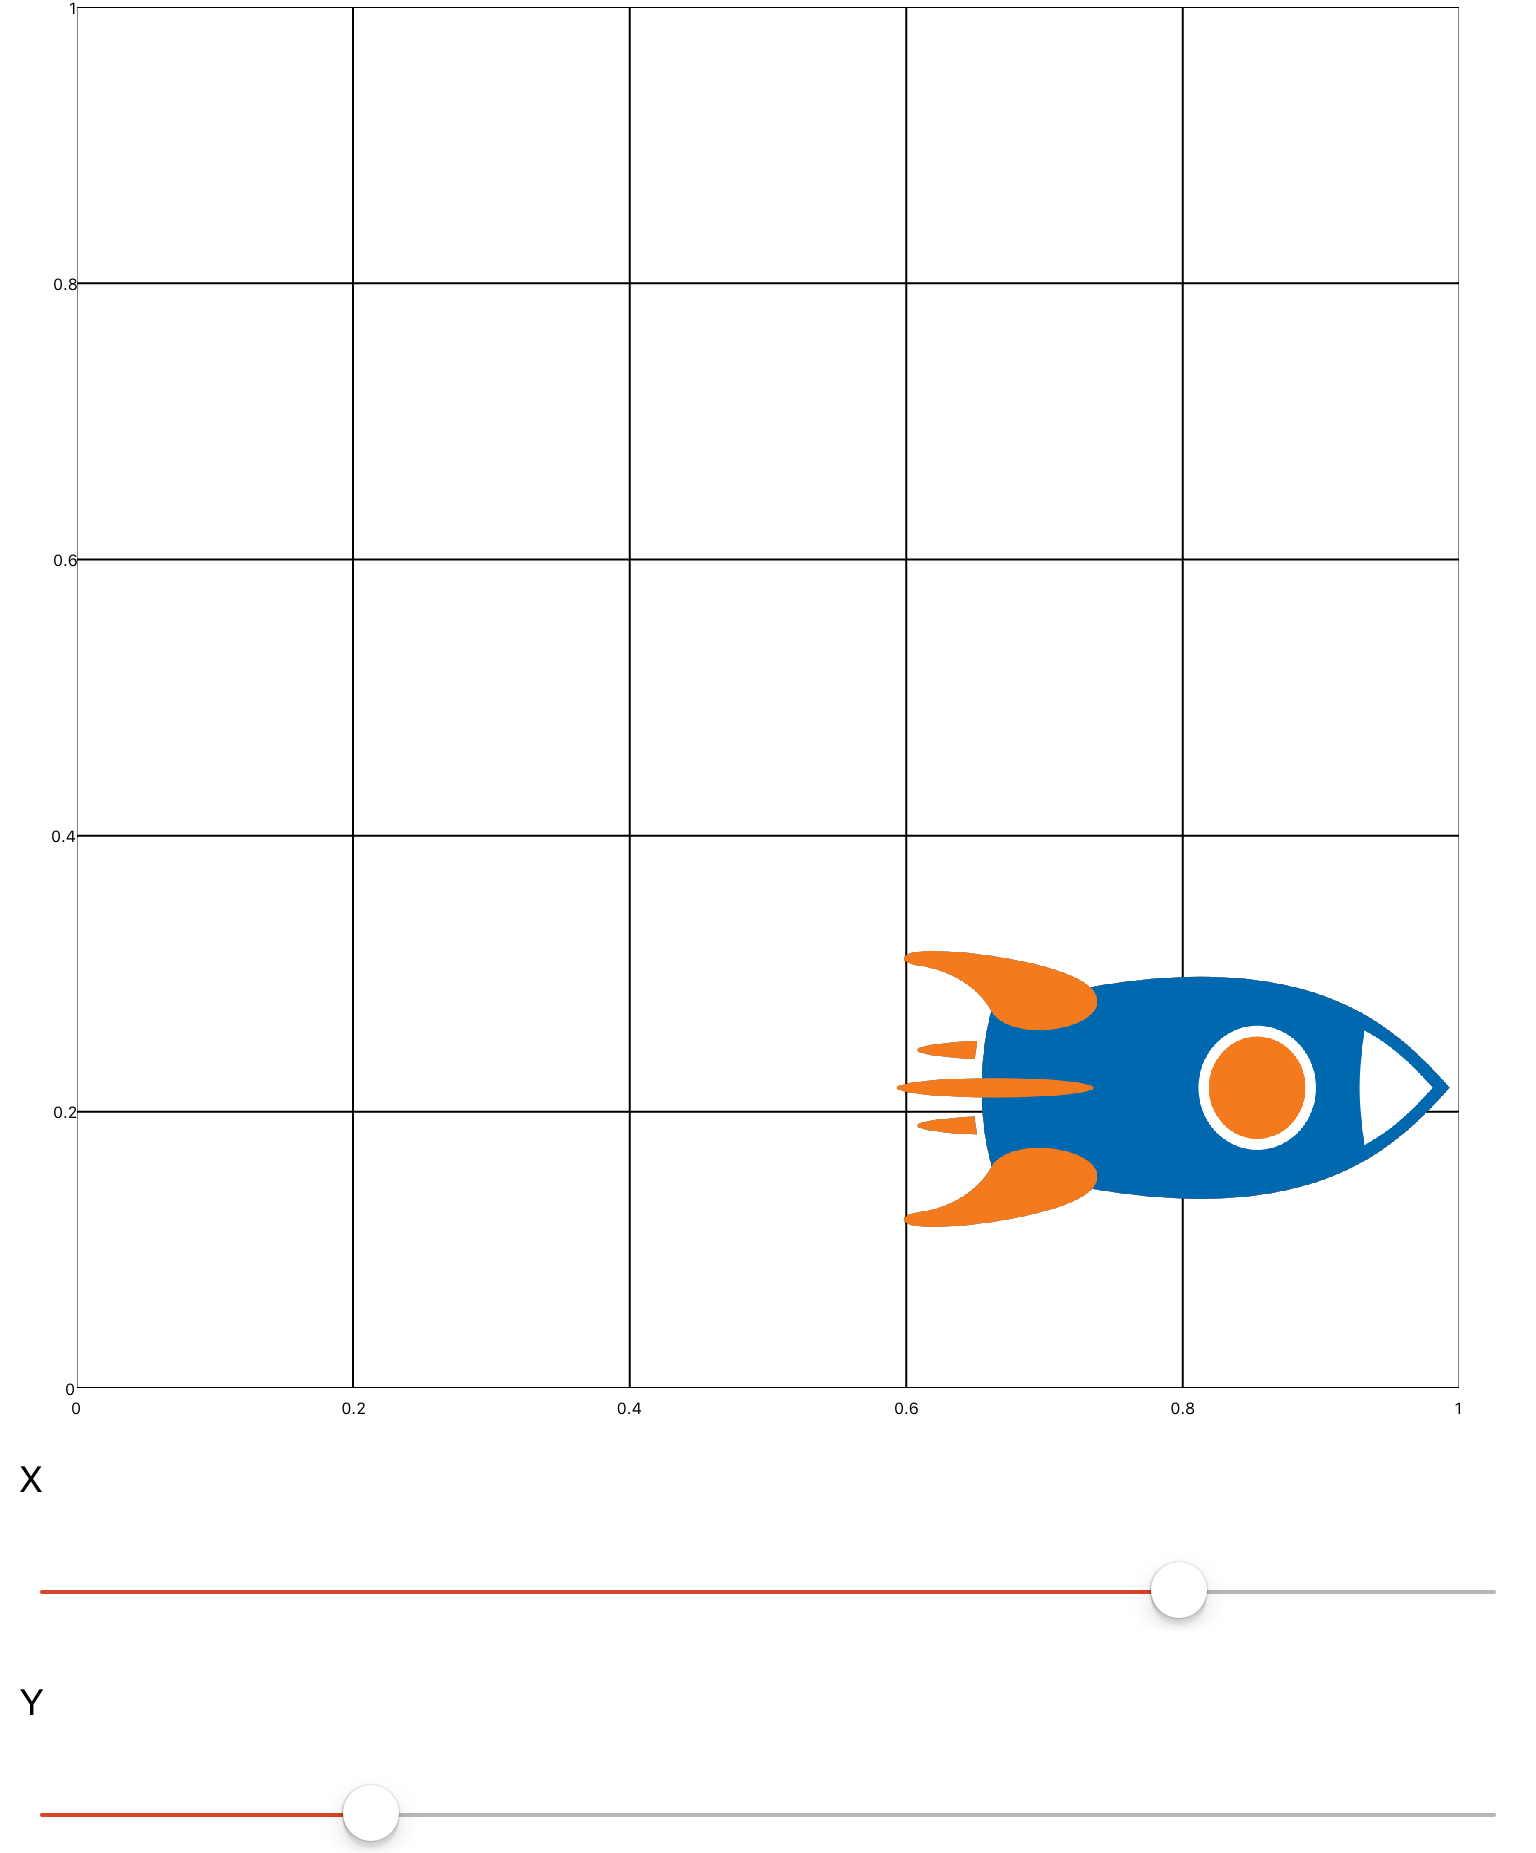
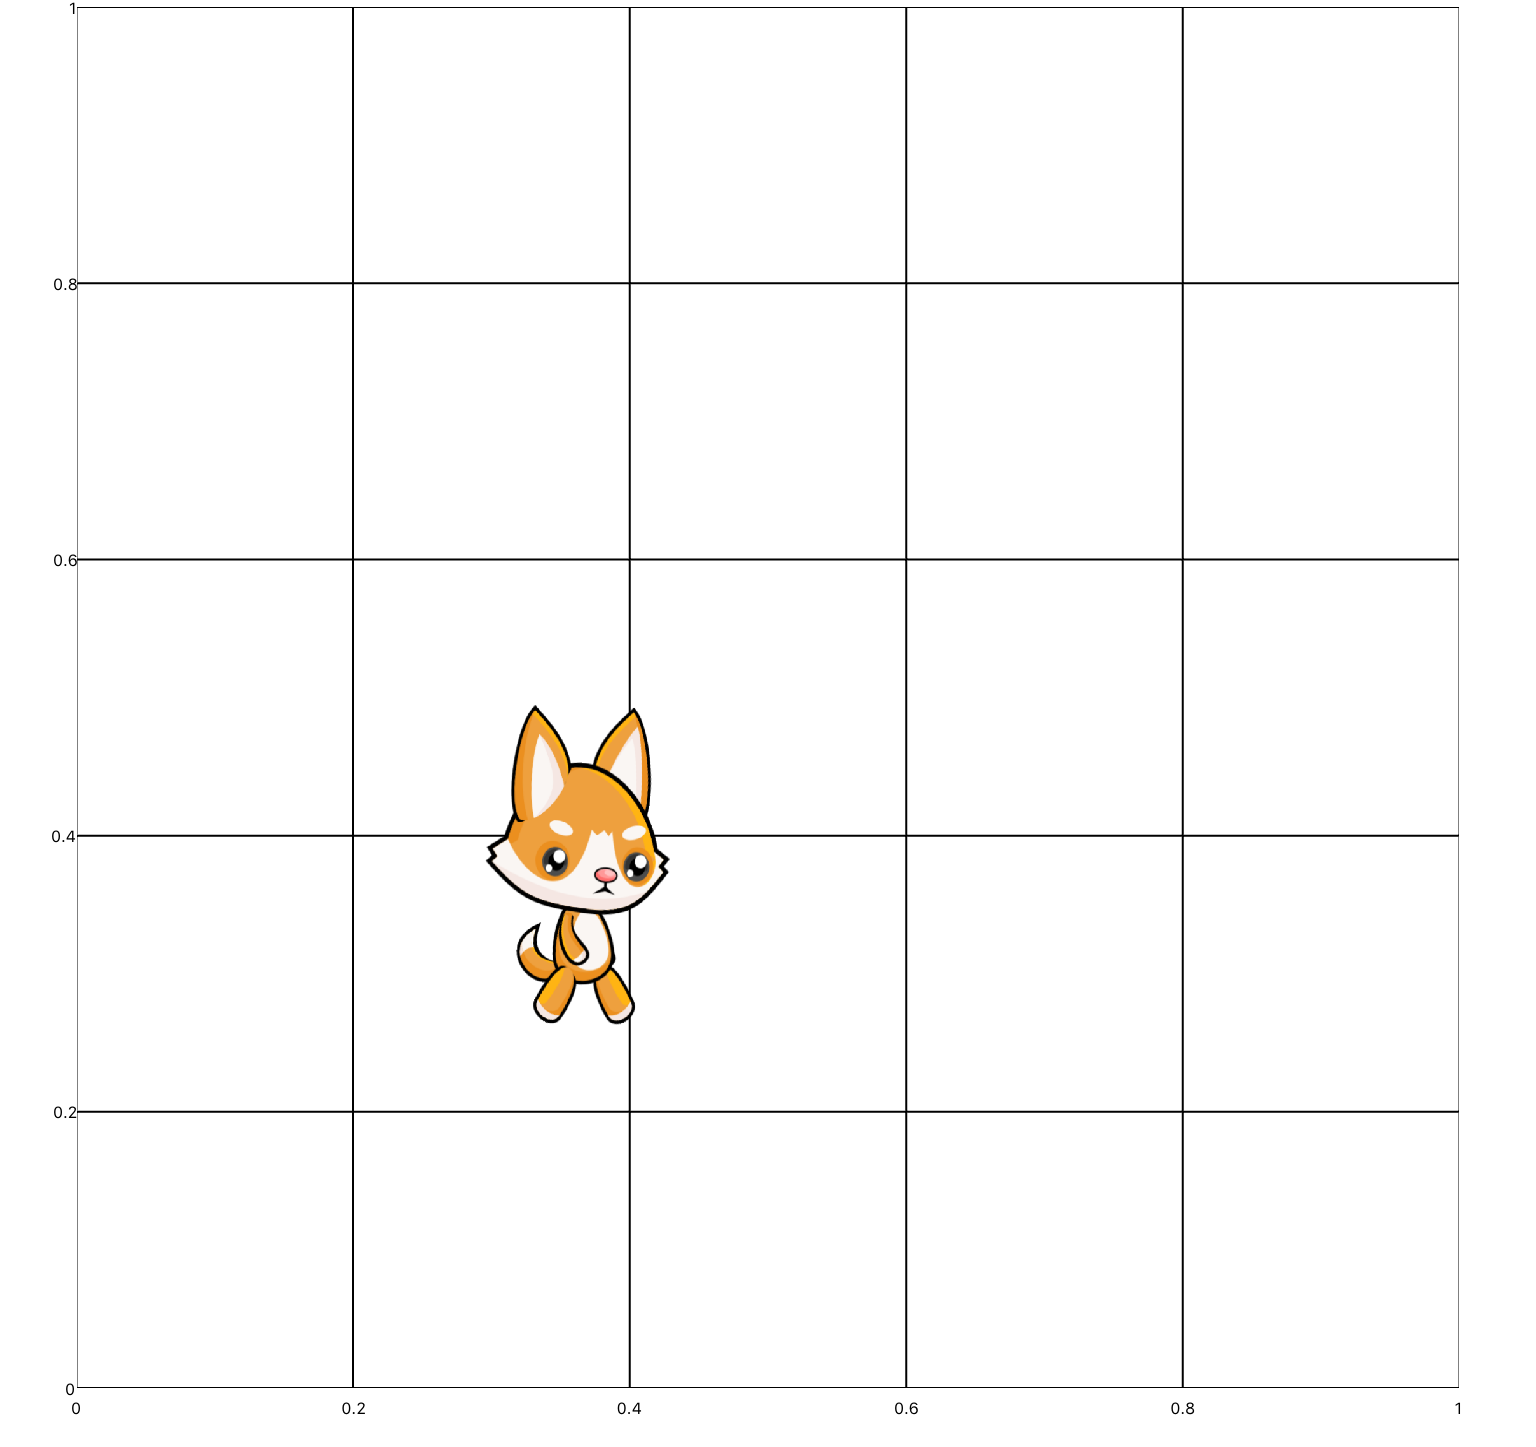
In the below example, the data points make a square on the plot centered at (0.5, 0.5). Since the rocket texture is more of a rectangular shape, the image looks distorted.

<series name="myRocket" draw="radialFill">
  <textureCoords ref="myTextureName">0 0; 0 1; 1 1; 1 0</textureCoords>
  <data>0.4 0.6; 0.4 0.4; 0.6 0.4; 0.6 0.6</data>
</series>
 
Image uploaded from iOS (1).png
 

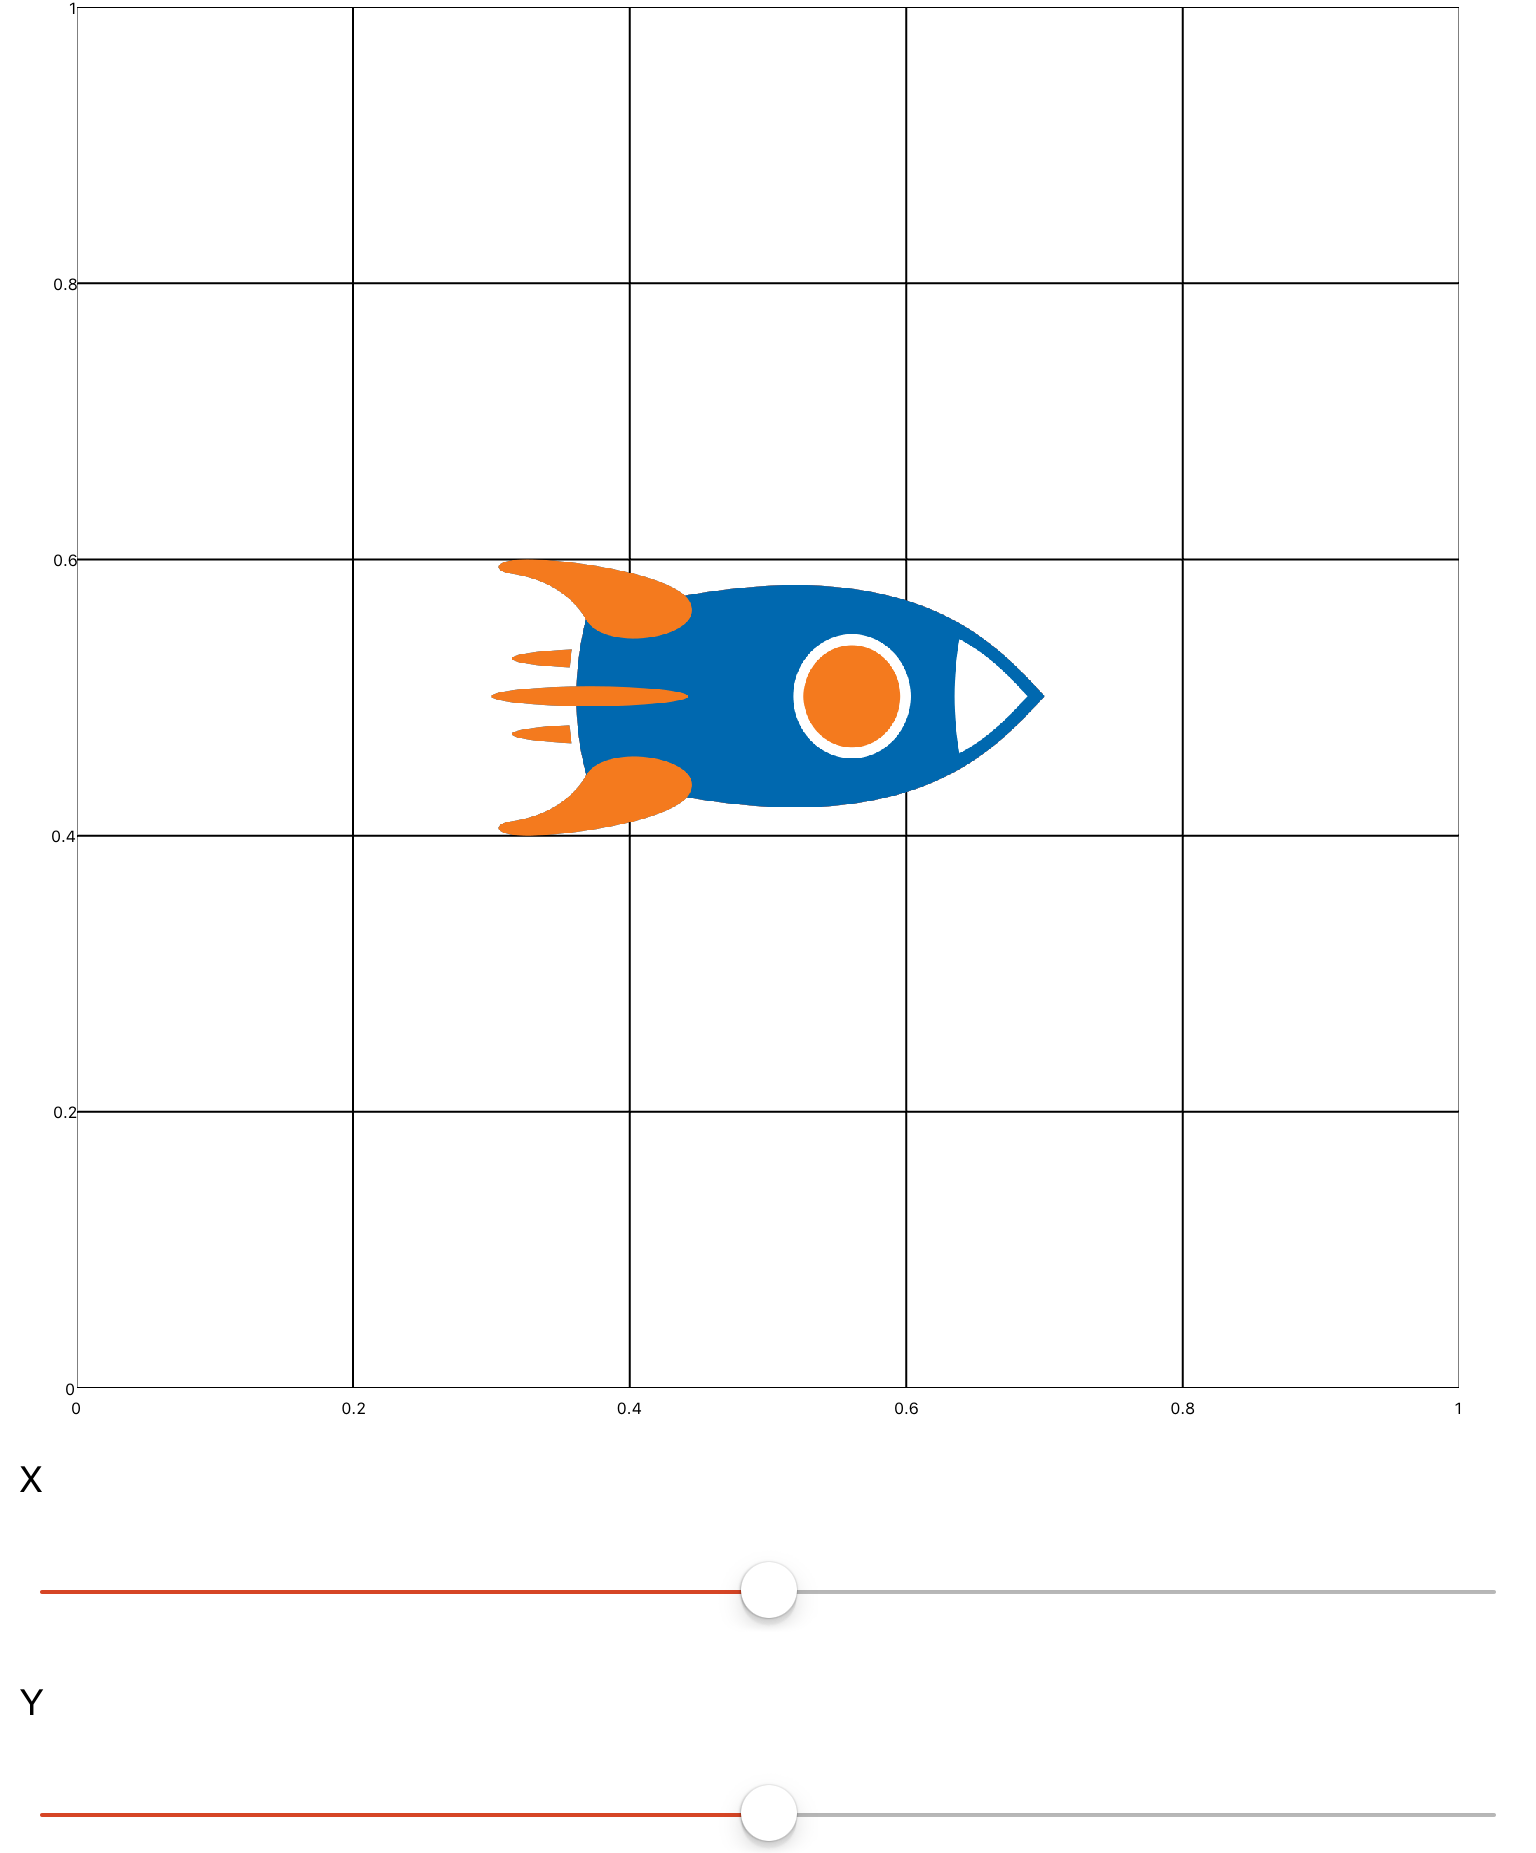
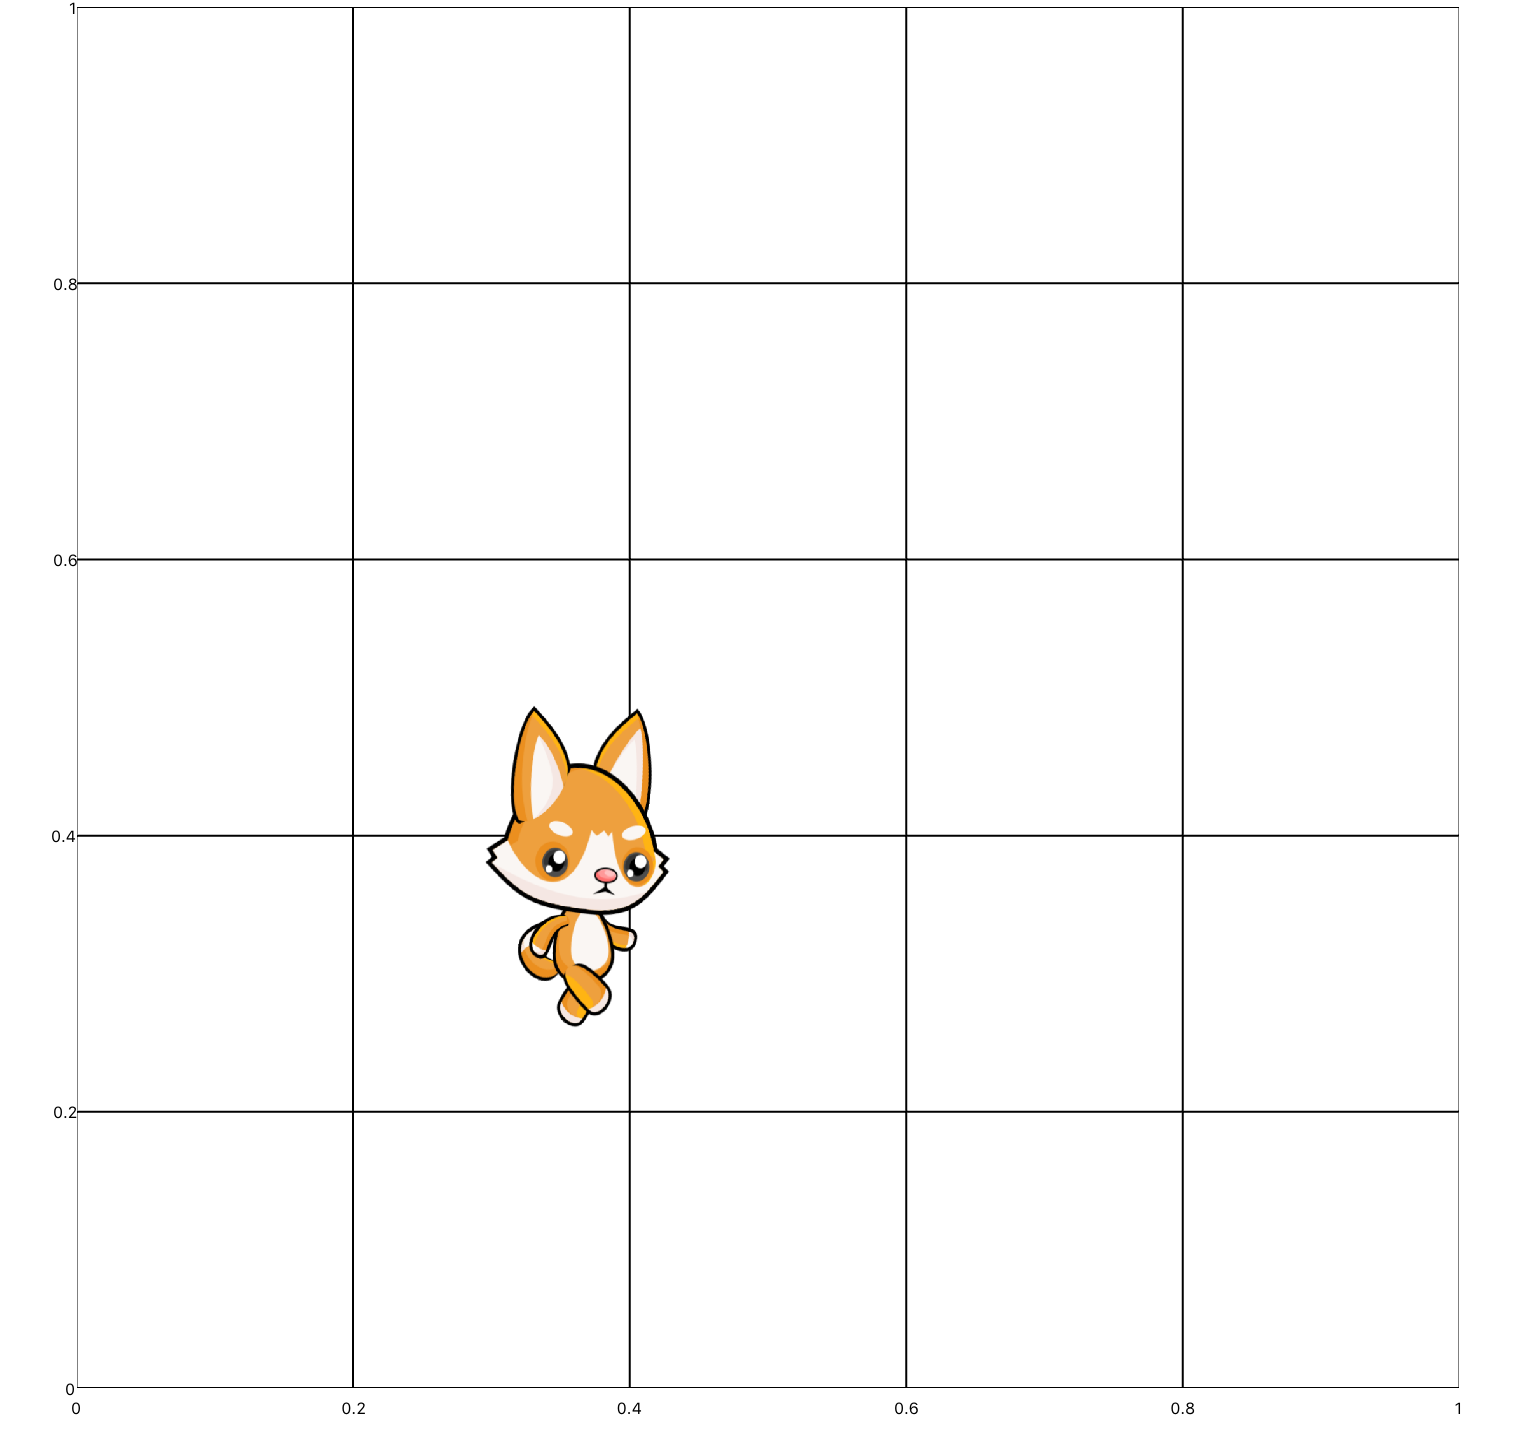
For a rectangular shape such as the rocket, points in a rectangle would be more appropriate.

<series name="myRocket" draw="radialFill">
  <textureCoords ref="myTextureName">0 0; 0 1; 1 1; 1 0</textureCoords>
  <data>0.3 0.6; 0.3 0.4; 0.7 0.4; 0.7 0.6</data>
</series>
 
Image uploaded from iOS.png
 

The aspect ratio of the plot also plays a role in how the image looks. For animations we recommend a 1 to 1 aspect ratio, with the scaling mode of one of the axes being set to lockAspectRatio.

<xyPlot name="myPlot">
   <style>
     <aspectRatio>1</aspectRatio>
   </style>
  <axis dim="x" auto="fixed" min="0" max="1" />
  <axis dim="y" auto="lockAspectRatio" />
  ...
</xyPlot>

Color

The color of a texture can be manipulated from inside qdex. For information on full-texture coloring and per-vertex coloring, read the Color section at left. 

For now, it is important to note that the true color of the texture will only be maintained if the series foreground color is set to white. You can do this by creating a style and applying it to your series, creating an inline style, or using the predefined style "sprite".

<style name="trueColor">
  <foreground color="white" />
</style>

<xyPlot name="myPlot">
  ...
  <series style="trueColor">
   ...
  </series>
</xyPlot>
<xyPlot name="myPlot">
  ...
  <series>
    <style>
      <foreground color="white" />
    </style>
   ...
  </series>
</xyPlot>
<xyPlot name="myPlot">
  ...
  <series style="sprite">
   ...
  </series>
</xyPlot>

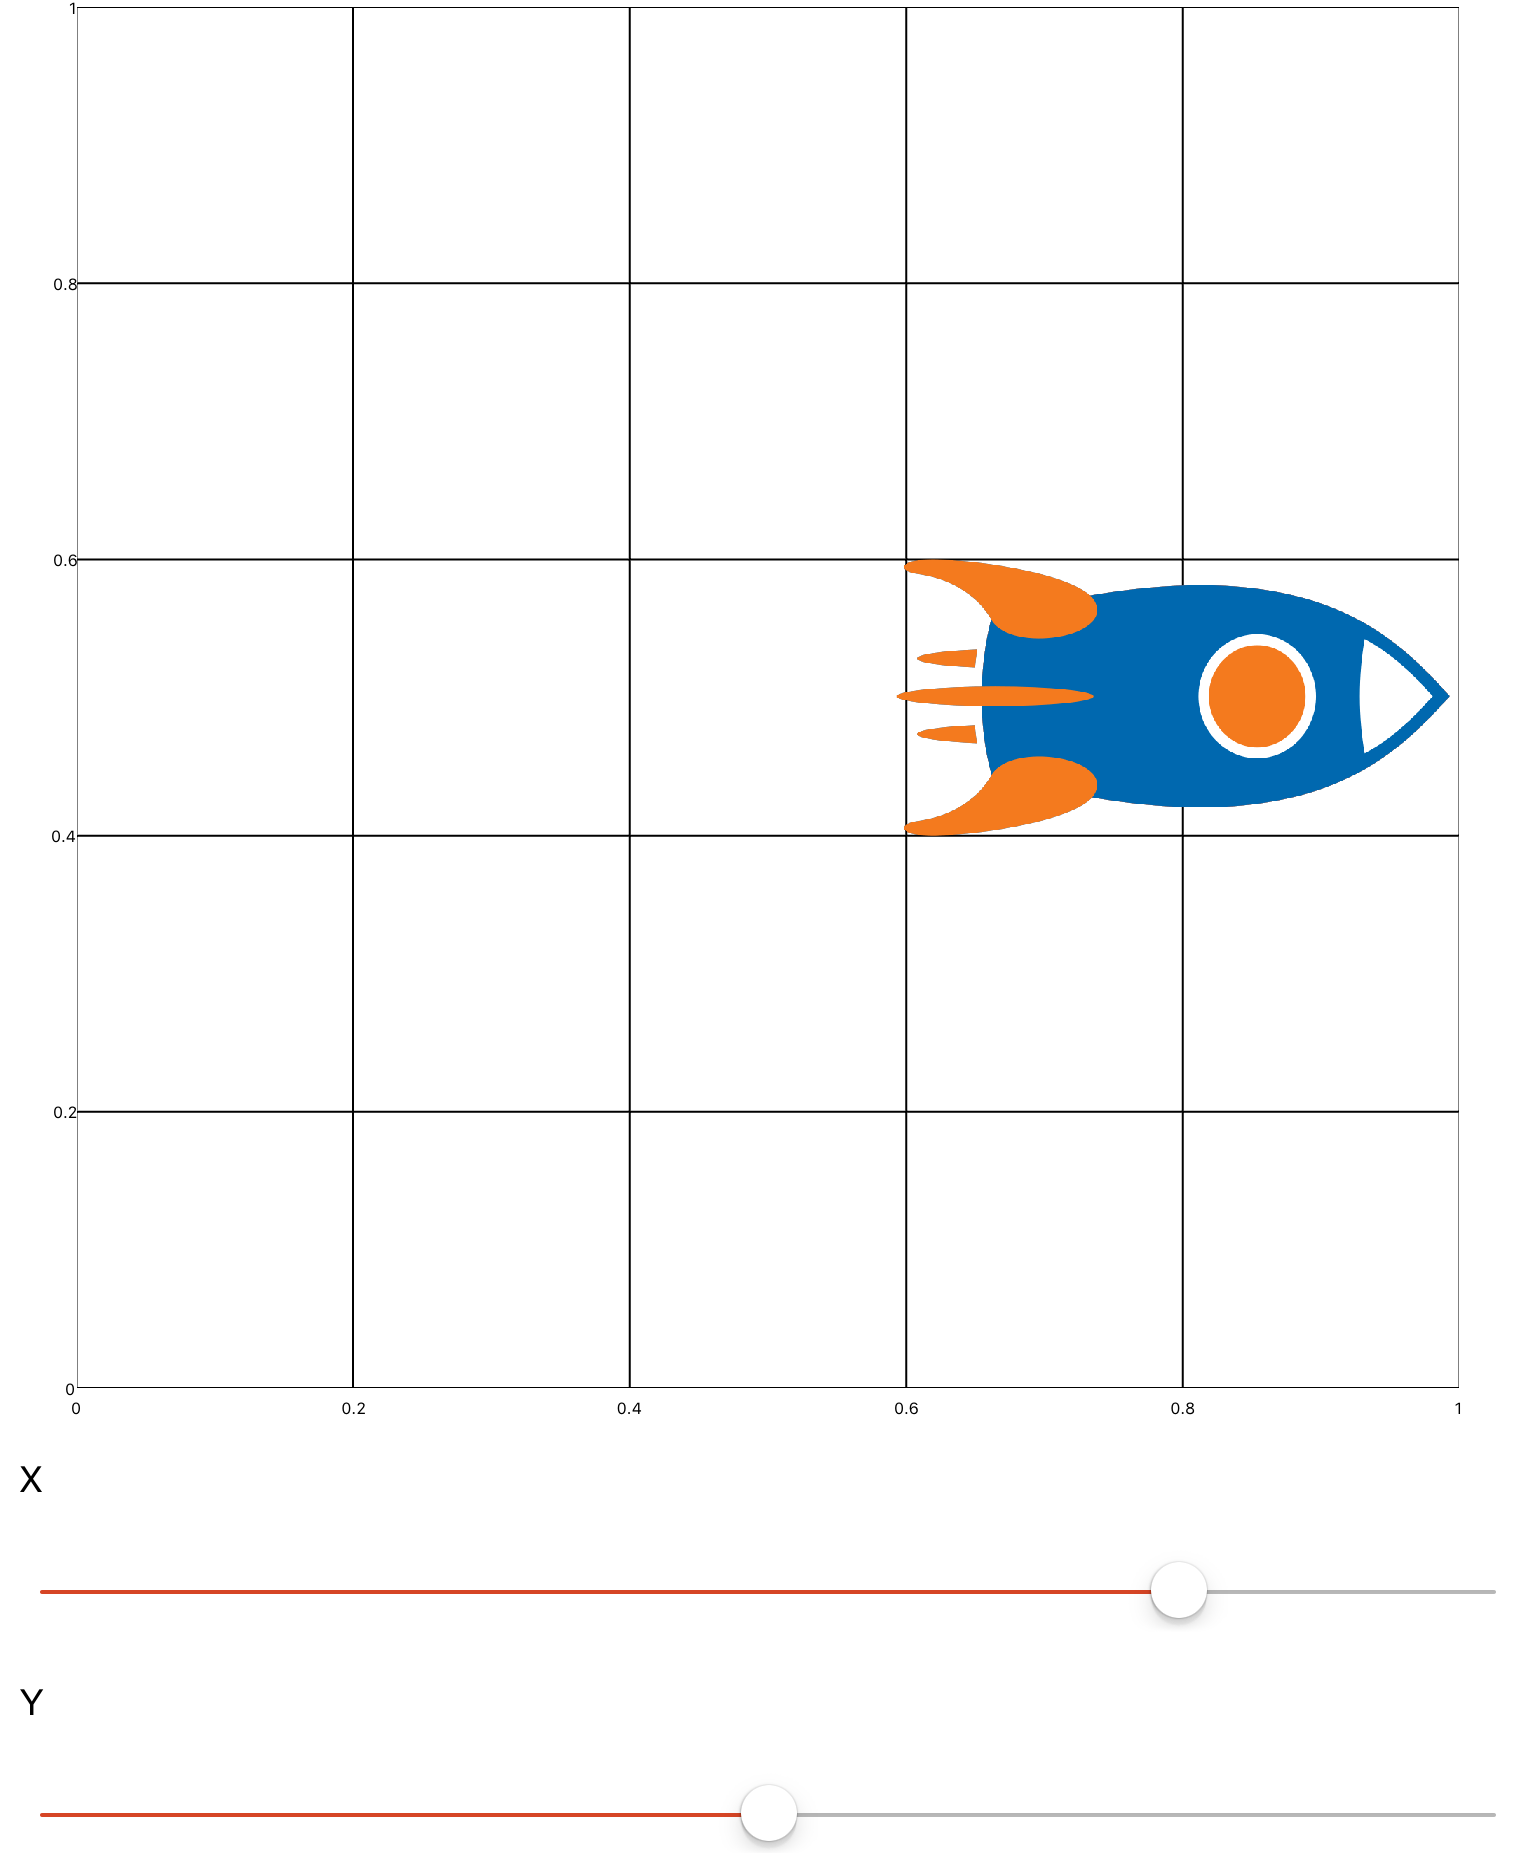
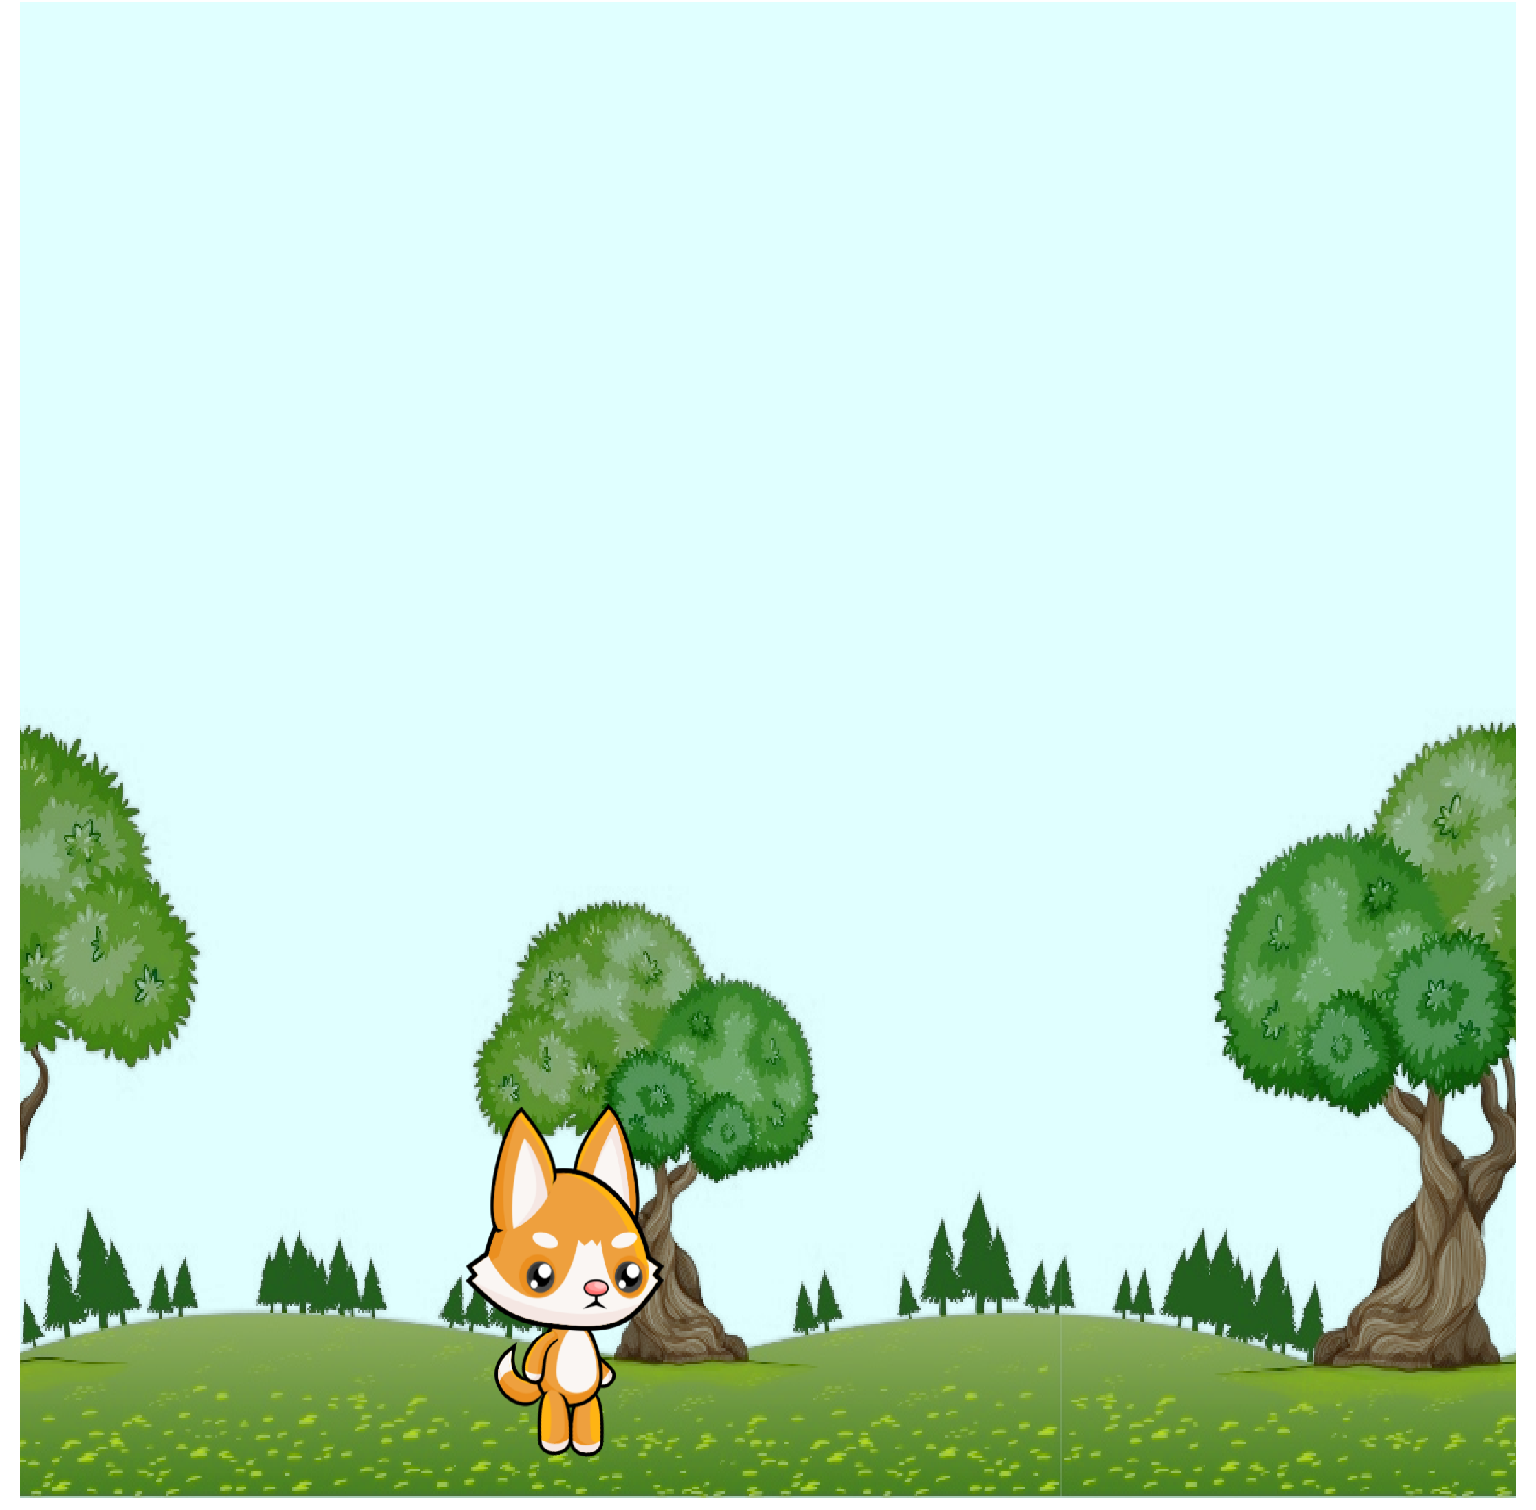
Putting it All Together

In this example, a rocket is added to the center of a plot.

<xyPlot>
  <style>
    <aspectRatio>1</aspectRatio>
  </style>
  <axis dim="x" auto="fixed" min="0" max="1" />
  <axis dim="y" auto="lockAspectRatio" />
  <texture name="rocketTexture">
    <image src="resources/rocket.png" />
  </texture>
  <series name="myRocket" draw="radialFill" style="sprite">
    <textureCoords ref="rocketTexture">0 0; 0 1; 1 1; 1 0</textureCoords>
    <data>0.3 0.6; 0.3 0.4; 0.7 0.4; 0.7 0.6</data>
  </series>
</xyPlot>
 
Image uploaded from iOS.png
 

Back to Knowledge Base

Simple Movement

There are a few ways that textures can be animated. The simplest method is using the animationTools.xml fragment, which uses matrix transforms to manipulate the shape. Alternatively, you can define matrices yourself.

Example 1

In this example, a rocket texture is shifted in the X and Y planes using both the animation tools move function, and the matrix translation property. 

<include src="animationTools.xml" />

<xyPlot name="plot">
  <style>
    <aspectRatio>1</aspectRatio>
  </style>
  <axis dim="x" auto="fixed" min="0" max="1" />
  <axis dim="y" auto="fixed" min="0" max="1" />
  <texture name="rocketTexture">
    <image src="resources/rocket.png" />
  </texture>
  <series name="rocket" draw="radialFill" style="trueColor" ignore="true">
    <data>0.3 0.6; 0.3 0.4; 0.7 0.4; 0.7 0.6</data>
    <textureCoords ref="rocketTexture">0 0; 0 1; 1 1; 1 0</textureCoords>
  </series>
</xyPlot>

<!-- Animation tools to move texture -->
<p>X</p>
<slider name="xSlider" min="-0.5" max="0.5">
  <onValueChanged>
    xVal = value
    yVal = ySlider.Value
    -- [Series].Transform = move([Series],[x Shift],[Y Shift])
    plot.rocket.Transform = move(plot.rocket,xVal,yVal)
  </onValueChanged>
</slider>

<!-- Matrix transform to move texture -->
<p>Y</p>
<slider name="ySlider" min="-0.5" max="0.5">
  <onValueChanged>
    xVal = xSlider.Value
    yVal = value
    plot.rocket.Transform = matrixf.translation(xVal, yVal, 0)
  </onValueChanged>
</slider>


Example 2

In this example a simulation is used to shift a rocket texture in the Y with the amplitude of a sine wave. The rotation property is also used to rotate the rocket along the path.

<drawing name="plot">
  <style>
    <aspectRatio>1</aspectRatio>
  </style>
  <axis dim="x" auto="fixed" min="0" max="1" />
  <axis dim="y" auto="fixed" min="0" max="1" />
  <texture name="rocketTexture">
    <image src="resources/rocket.png" />
  </texture>
  <series name="rocket" draw="radialFill" style="trueColor">
    <textureCoords ref="rocketTexture">0 0; 0 1; 1 1; 1 0</textureCoords>
    <data>0 0.25; 0 0; 0.5 0; 0.5 0.25</data>
  </series>
</drawing>

<simulation name="sim">
  <onActivePageChanged>
    if active then
    sim:Start();
    else
    sim:Stop();
    end
  </onActivePageChanged>
  <solver>
    <series>
      <sine amplitude="0.1" frequency="0.25" bias="0.4" />
      <system>
        <input name="amp" width="1" />
        <output name="ampOut" width="1" />
        <onOutputs>
          sineAmp = amp[1]
          return amp;
        </onOutputs>
      </system>
      <derivative />
      <system>
        <input name="angle" width="1" />
        <onOutputs>
          plot.rocket.Transform = matrixf.translation(0.25, sineAmp, 0)*matrixf.rotationAboutAxis(0, 0, 1, math.atan(angle[1]));
        </onOutputs>
      </system>
    </series>
  </solver>
</simulation>


Back to Knowledge Base

Advanced Movement

The second way that textures can be animated is by redefining the textureCoords or data points. These methods are very similar to basic plot animation, where points are recalculated and updated.

Example 1

In this example, a rocket texture is shifted in the X and Y directions using sliders. The data points are cleared, recalculated, and updated each time a slider is moved.

<xyPlot name="plot">
  <style>
    <aspectRatio>1</aspectRatio>
  </style>
  <axis dim="x" auto="growOnly" min="0" max="1" />
  <axis dim="y" auto="growOnly" min="0" max="1" />
  <texture name="rocketTexture">
    <image src="resources/rocket.png" />
  </texture>
  <series name="rocket" draw="radialFill" style="trueColor" manual="true">
    <textureCoords ref="rocketTexture">0 0; 0 1; 1 1; 1 0</textureCoords>
    <data>0.3 0.6; 0.3 0.4; 0.7 0.4; 0.7 0.6</data>
  </series>
</xyPlot>

<p>X</p>
<slider name="xSlider" min="-0.5" max="0.5">
  <onValueChanged>
    xVal = value
    yVal = ySlider.Value

    -- Add each new data point separately
    plot.rocket:Clear();
    plot.rocket:Add(0.3 + xVal, 0.6 + yVal);
    plot.rocket:Add(0.3 + xVal, 0.4 + yVal);
    plot.rocket:Add(0.7 + xVal, 0.4 + yVal);
    plot.rocket:Add(0.7 + xVal, 0.6 + yVal);
    plot.rocket:Update()
  </onValueChanged>
</slider>

<p>Y</p>
<slider name="ySlider" min="-0.5" max="0.5">
  <onValueChanged>
    xVal = xSlider.Value
    yVal = value

    -- Add each new data point to a matrix, add at once
    local shift = matrixf({ {0.3 + xVal, 0.6 + yVal}, {0.3 + xVal, 0.4 + yVal}, {0.7 + xVal, 0.4 + yVal}, {0.7 + xVal, 0.6 + yVal}  });

    plot.rocket:Clear();
    plot.rocket:Add(shift);
    plot.rocket:Update()
  </onValueChanged>
</slider>


Example 2

This example updates the textureCoords of an image to simulate movement. Given an image of a character in multiple stages of walking, it is possible to shift between each frame of the image quickly to give the appearance of walking.

Dog_Walking.png
<xyPlot name="plot">
  <style>
    <aspectRatio>1</aspectRatio>
  </style>
  <axis dim="x" auto="fixed" min="0" max="1" />
  <axis dim="y" auto="fixed" min="0" max="1" />
  <texture name="walkingTexture">
    <image src="resources/Dog_Walk.png" />
  </texture>
  <series name="dog" draw="triangles" style="trueColor" manual="true">
    <!-- Texture coordinates only capture first 1/10 of the image (one frame of the dog) -->
    <textureCoords ref="walkingTexture">0 0; 0.1 0; 0.1 1; 0 0; 0 1; 0.1 1</textureCoords>
    <data>0.25 0.5; 0.5 0.5; 0.5 0.25; 0.25 0.5; 0.25 0.25; 0.5 0.25</data>
  </series>
</xyPlot>

<simulation name="sim">
  <onActivePageChanged>
     if active then
         sim:Start();
     else
         sim:Stop();
     end
  </onActivePageChanged>
  <onUpdate>
     -- Cycle through all 10 images every 0.75 seconds, then return to the beginning (the % operator ensures that after 10 frames, we return to frame 1)
     local xd = (1/10) * math.floor((10/0.75) * (time % 0.75))
     
     local walkingCoords = matrixf({ {xd, 0}, {xd + (1/10), 0}, {xd + (1/10), 1}, {xd, 0}, {xd, 1}, {xd + (1/10), 1} });  
     
     plot.dog.TextureCoordinates.Points:Clear();
     plot.dog.TextureCoordinates.Points:Add(walkingCoords);

     plot.dog:Update();
  </onUpdate>
</simulation>


Example 3

In this example, the textureCoords of a background image are updated in small increments to create a continuous background. Given an image of a repeating texture, the coordinates can be continuously shifted to simulate the appearance of movement.

trees_background.png
<drawing name="plot">
  <style>
    <aspectRatio>1</aspectRatio>
  </style>
  <axis dim="x" auto="fixed" min="0" max="1" />
  <axis dim="y" auto="fixed" min="0" max="1" />
  <texture name="walkingTexture">
    <image src="resources/Dog_Walk.png" />
  </texture>
  <texture name="backgroundTexture">
    <image src="resources/trees.png" />
  </texture>
  <!-- Sky color -->
  <series name="sky" draw="radialFill">
    <style>
      <foreground color="lightCyan" />
    </style>
    <data>0 0; 1 0; 1 1; 0 1</data>
  </series>
  <series name="trees" draw="triangles" style="trueColor" manual="true">
    <textureCoords ref="backgroundTexture">0 0; 1 0; 1 1; 0 0; 0 1; 1 1</textureCoords>
    <data>0 0; 1 0; 1 0.6; 0 0; 0 0.6; 1 0.6</data>
  </series>
  <series name="dog" draw="triangles" style="trueColor" manual="true">
    <textureCoords ref="walkingTexture">0 0; 0.1 0; 0.1 1; 0 0; 0 1; 0.1 1</textureCoords>
    <data>0.25 0.27; 0.5 0.27; 0.5 0.02; 0.25 0.27; 0.25 0.02; 0.5 0.02</data>
  </series>
</drawing>

<simulation name="sim">
  <onActivePageChanged>
     if active then
         sim:Start();
     else
         sim:Stop();
     end
  </onActivePageChanged>
  <onUpdate>
      -- Dog movement
      local xd = (1/10) * math.floor((10/0.75) * (time % 0.75))
      
      local walkingCoords = matrixf({ {xd, 0}, {xd + (1/10), 0}, {xd + (1/10), 1}, {xd, 0}, {xd, 1}, {xd + (1/10), 1} });  
    
      plot.dog.TextureCoordinates.Points:Clear();
      plot.dog.TextureCoordinates.Points:Add(walkingCoords);
      
     -- Since background is repeated 3 times, shift the coordinates until the image is 2/3 of the way through, which occurs every 20 seconds
      local xb = (time % 20) / 30
      local shiftBG = (1/3)
      local backgroundCoords = matrixf({ {xb, 1}, {xb + shiftBG, 1}, {xb + shiftBG, 0}, {xb, 1}, {xb, 0}, {xb + shiftBG, 0} });        
      
      plot.trees.TextureCoordinates.Points:Clear();
      plot.trees.TextureCoordinates.Points:Add(backgroundCoords);

      plot.dog:Update();
      plot.trees:Update();
  </onUpdate>
</simulation>


Back to Knowledge Base

Texture Coloring

Textures can be colored by updating the foreground style of their series, or by changing their per-vertex colors.

Example 1

In this example, three cloud textures are recolored using different methods. 

<drawing name="plot">
  <style>
    <aspectRatio>1</aspectRatio>
  </style>
  <axis dim="x" auto="fixed" min="0" max="1" />
  <axis dim="y" auto="fixed" min="0" max="1" />
  <texture name="cloudTexture">
    <image src="resources/clouds.png" />
  </texture>
  <series name="sky" draw="radialFill">
    <style>
      <foreground color="lightCyan" />
    </style>
    <data>0 0; 1 0; 1 1; 0 1</data>
  </series>
  <series name="clouds1" draw="radialFill" style="trueColor" manual="true">
    <data>1 0.9; 0 0.9; 0 0.6; 1 0.6 </data>
    <textureCoords ref="cloudTexture">0 0; 1 0; 1 1; 0 1</textureCoords>
  </series>
  <series name="clouds2" draw="radialFill" style="trueColor" manual="true">
    <data>1 0.6; 0 0.6; 0 0.3; 1 0.3 </data>
    <textureCoords ref="cloudTexture">0 0; 1 0; 1 1; 0 1</textureCoords>
  </series>
  <series name="clouds3" draw="radialFill" style="trueColor" manual="true">
    <data>1 0.3; 0 0.3; 0 0; 1 0 </data>
    <textureCoords ref="cloudTexture">0 0; 1 0; 1 1; 0 1</textureCoords>
  </series>
</drawing>

<simulation name="sim">
  <onActivePageChanged>
      if active then
          sim:Start();
      else
          sim:Stop();
      end
  </onActivePageChanged>
  <onUpdate>
    -- Changing the color of an entire texture with time (adjusting R with time)
    plot.clouds1.Style.ForegroundColor = color.rgb(255*0.5*(math.sin(0.2*math.pi*time)+1), 255, 255);

    -- Changing the alpha of an entire texture with time
    plot.clouds2.Style.ForegroundColor = color.rgba(255, 255, 255, 255*0.5*(math.sin(0.2*math.pi*time)+1));

    -- Changing the per-vertex colors of a texture, including the alpha
    plot.clouds3.Colors:Clear();
    plot.clouds3.Colors:Add(color.yellow);
    plot.clouds3.Colors:Add(color.rgba(255*0.5*(math.sin(0.2*math.pi*time)+1), 255*0.5*(math.cos(0.2*math.pi*time)+1), 200, 255));
    plot.clouds3.Colors:Add(color.yellow);
    plot.clouds3.Colors:Add(color.rgba(255*0.5*(math.sin(0.2*math.pi*time)+1), 50, 0,  255*0.5*(math.cos(0.2*math.pi*time)+1)));

    plot.clouds1:Update();
    plot.clouds2:Update();
    plot.clouds3:Update();
  </onUpdate>
</simulation>