
Animation Tools
The animation tools fragment makes it easy to animate data, shapes, and images. Just pass the name of the plot series and the required parameters to the function and it will perform the necessary point manipulation to move, rotate, or scale the data.
To add the animation tools fragment to your app, download it by clicking the button above. Unzip the folder. You can drag-and-drop the xml file directly into your project in the solution explorer window in Visual Studio, or you can right click on your module and click Add > Existing Item (you may have to switch the file type from Visual C# Files to All Files).
Once added to your project, include the fragment in your module by placing the following code at the top of your document (above your first section).
<include src="animationTools.xml" />
The animation tools fragment includes three functions:
move([Series],[x Shift],[Y Shift])
Translates a shape along the X and Y axes. Note that the plot data is shifted with respect to its current position; a shift of -2 in the X doesn’t center the shape at -2, but moves it in the X by -2.
rotate([Series],[Angle])
Rotates a shape about itself based on the specified angle. Angle must be specified in degrees.
scale([Series],[x Scale Factor],[Y Scale Factor])
Scales a shape based on the specified X and Y scale factors.
To use each function equate the transform property of the selected series to the function.
plotName.seriesName.Transform = functionName(plotName.seriesName, param1, param2,...)
Example 1
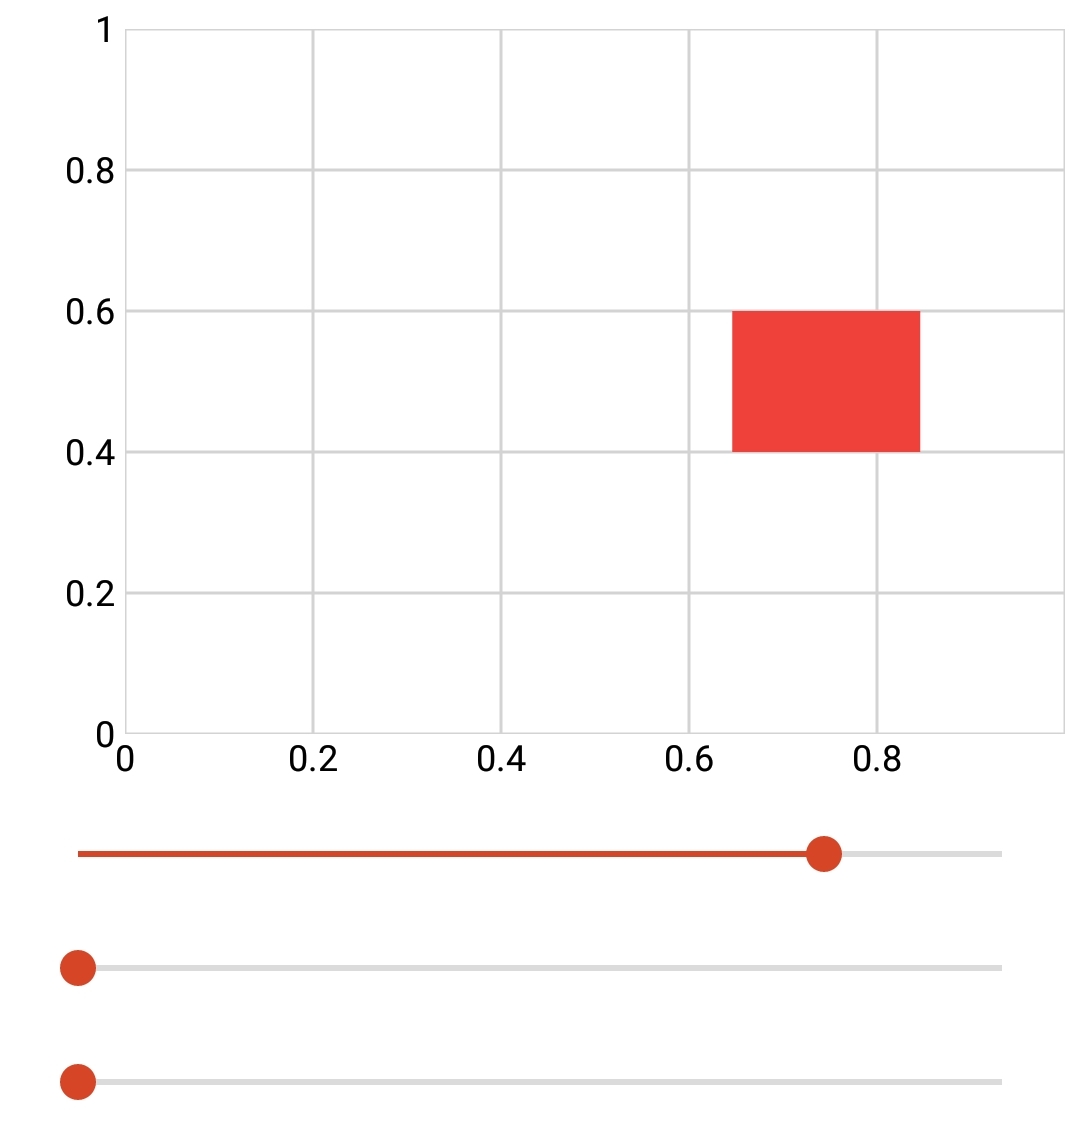
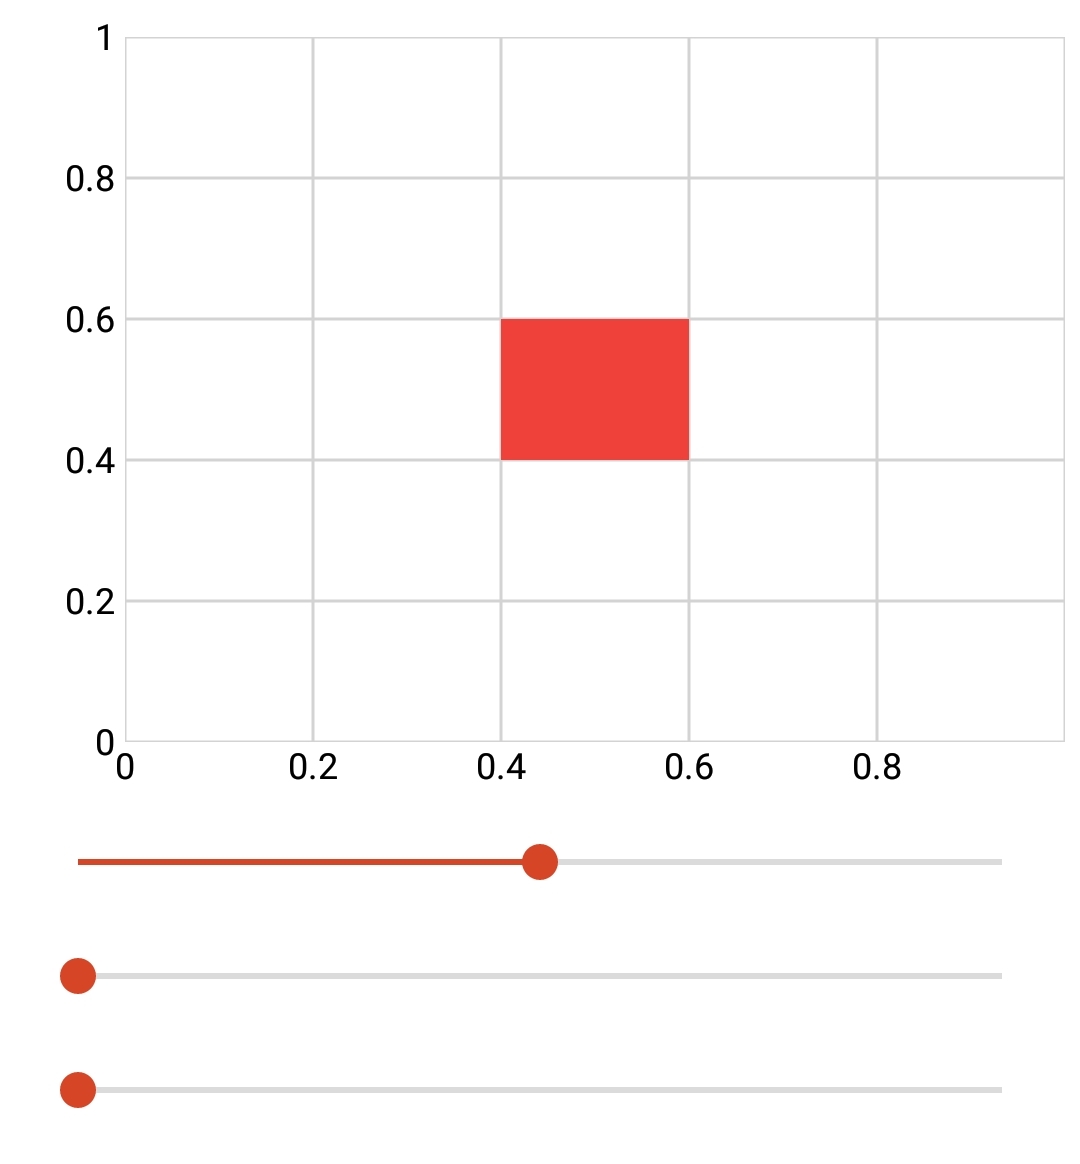
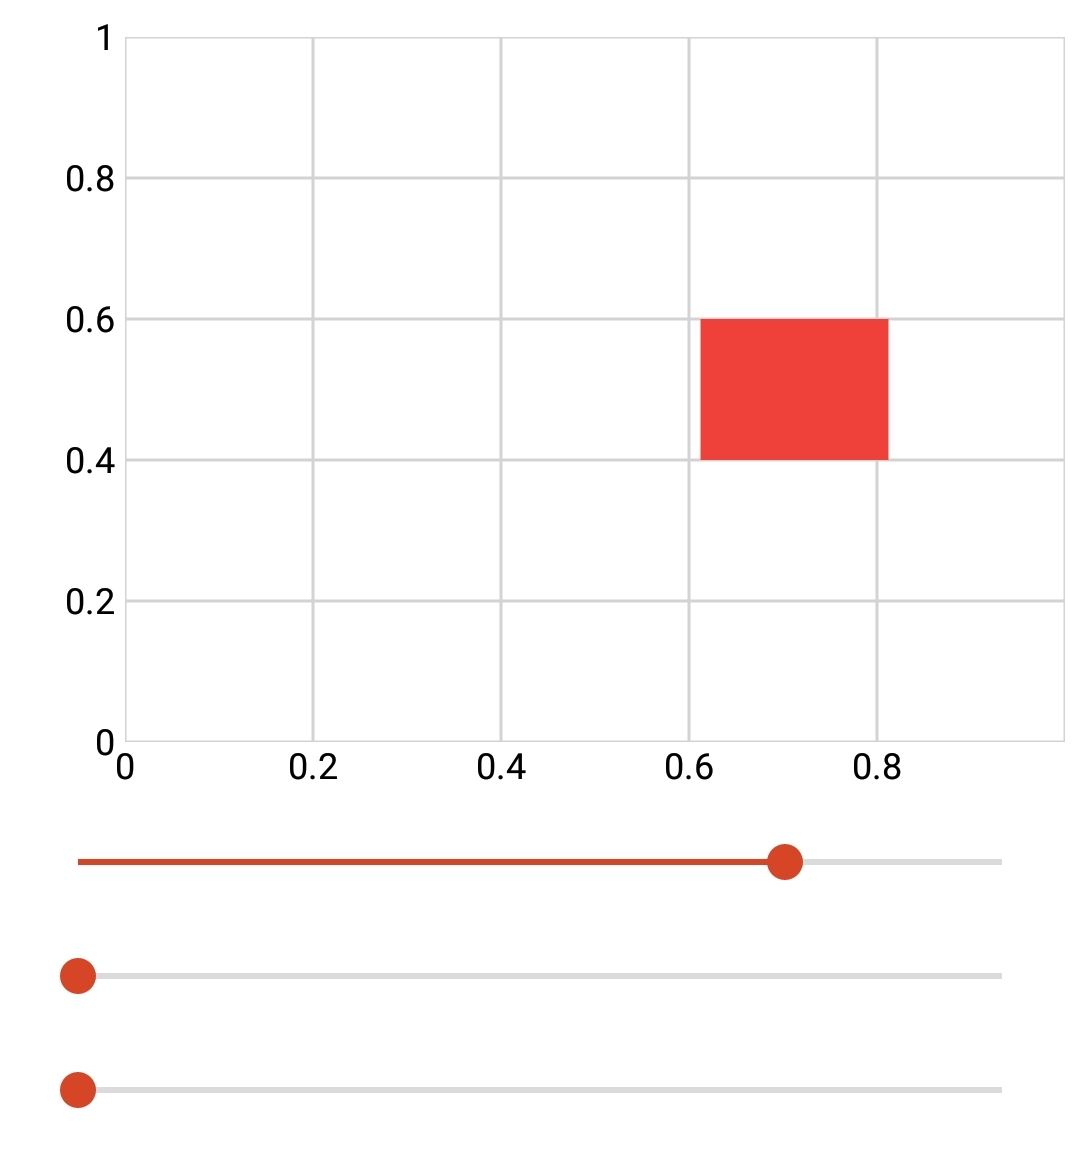
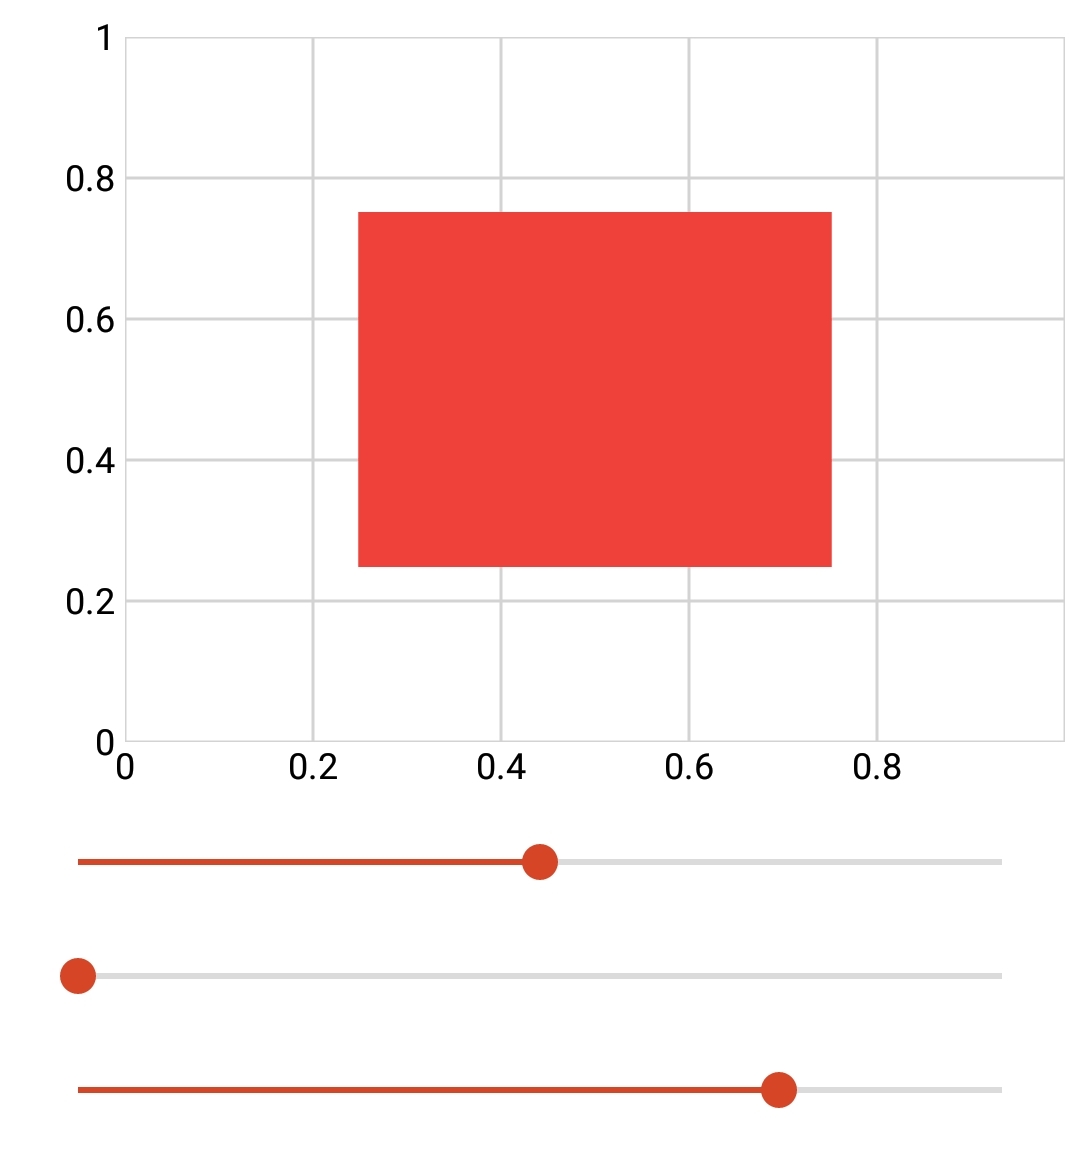
The first example uses 3 sliders to move a square in the X, rotate a square about itself, and scale a square in the X and Y.
You may notice that the sliders are working independently of each other; if you change the rotation slider, then scale the shape, the rotation is not maintained. For an example of combining the above functions, see Example 2.
<include src="animationTools.xml" />

<xyPlot name="myPlot">
  <axis dim="x" auto="fixed" min="0" max="1" />
  <axis dim="y" auto="fixed" min="0" max="1" />
  <series name="myShape" draw="radialFill">
    <data>0.4 0.4; 0.4 0.6; 0.6 0.6; 0.6 0.4</data>
  </series>
</xyPlot>

<script>
  local x = 0
  local angle = 0
  local myScale = 1
</script>

<slider min="-0.4" max="0.4">
  <onValueChanged>
    x = value
    myPlot.myShape.Transform = move(myPlot.myShape,x,0)
  </onValueChanged>
</slider>

<slider min="0" max="360">
  <onValueChanged>
    angle = value
    myPlot.myShape.Transform = rotate(myPlot.myShape, angle)
  </onValueChanged>
</slider>

<slider min="1" max="3">
  <onValueChanged>
    myScale = value
    myPlot.myShape.Transform = scale(myPlot.myShape, myScale, myScale)
  </onValueChanged>
</slider>

Example 2
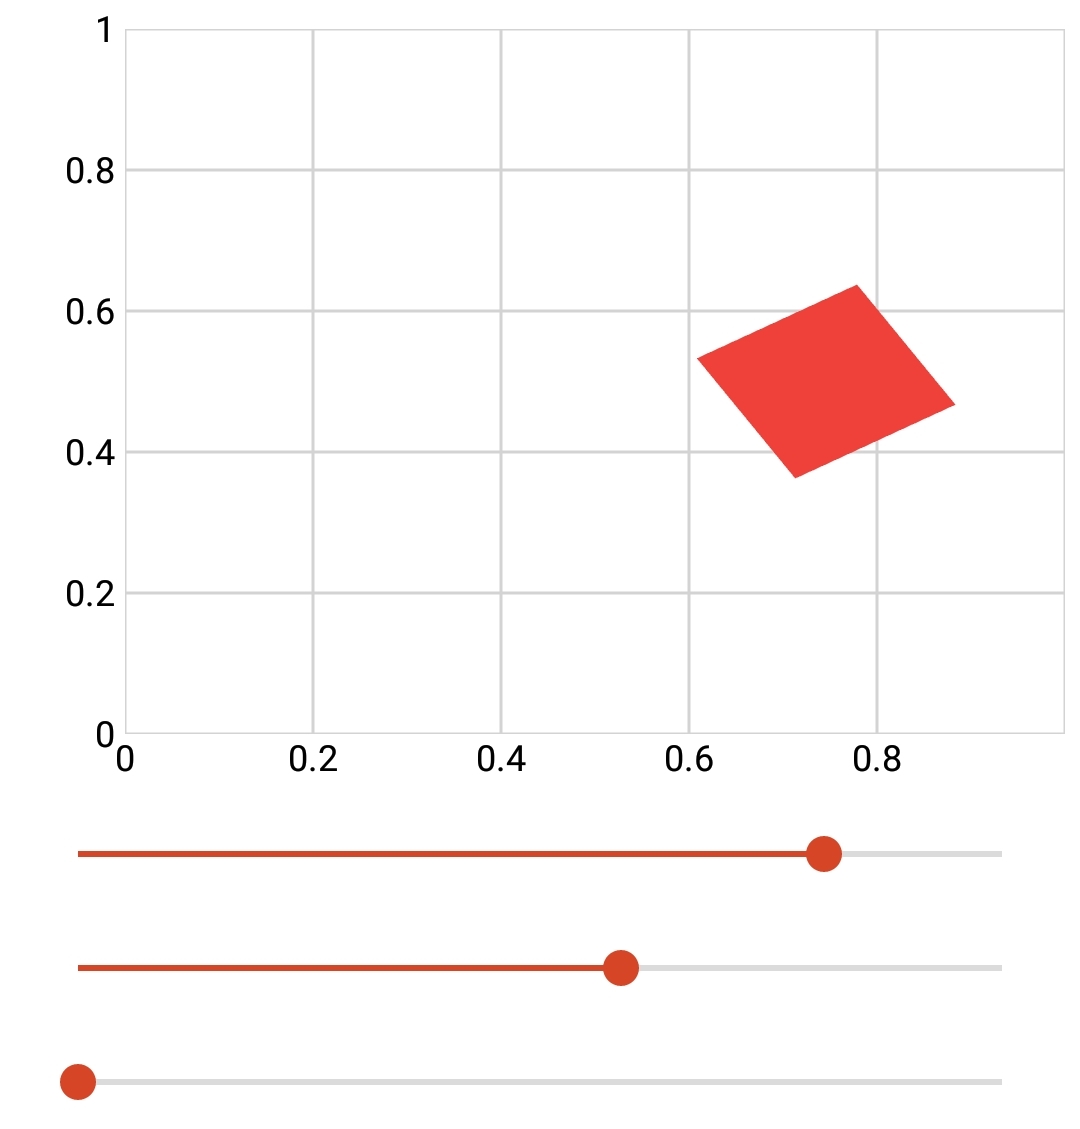
The first example uses 3 sliders to move a square in the X, rotate a square about itself, and scale a square in the X and Y. The sliders work dependently so that animation changes are maintained when you update values. This is done by multiplying the functions together. Note that functions must be multiplied in the order:
Move * Rotate * Scale.
<include src="animationTools.xml" />

<xyPlot name="myPlot">
  <axis dim="x" auto="fixed" min="0" max="1" />
  <axis dim="y" auto="fixed" min="0" max="1" />
  <series name="myShape" draw="radialFill">
    <data>0.4 0.4; 0.4 0.6; 0.6 0.6; 0.6 0.4</data>
  </series>
</xyPlot>

<script>
  local x = 0
  local angle = 0
  local myScale = 1

  local function updateShape()
    -- Move, Rotate, Scale
    myPlot.myShape.Transform = move(myPlot.myShape,x,0)*rotate(myPlot.myShape, angle)*scale(myPlot.myShape, myScale, myScale)
  end
</script>

<slider min="-0.4" max="0.4">
  <onValueChanged>
    x = value
    updateShape()
  </onValueChanged>
</slider>

<slider min="0" max="360">
  <onValueChanged>
    angle = value
    updateShape()
  </onValueChanged>
</slider>

<slider min="1" max="4">
  <onValueChanged>
    myScale = value
    updateShape()
  </onValueChanged>
</slider>